

【RCI3 Main Line + mBDSR】EURUSD 5-minute chart Example of a pullback sell signal
※Campaign is ongoing until January 10, 2019.
The sales page for BODSOR ishere.
※ BODSOR is an indicator developed to improve entry accuracy when buying on dips or selling on rallies using the RCI 3-line.
This time, an extra indicator 【mBDSR】 has been included with 【BODSOR】.
【mBDSR】 (extra indicator):
The development concept is the same as for 【BODSOR】,【 but the arrow signal generation conditions and its calculation method are completely
different.
Since more arrow signals are generated than in 【BODSOR】, it increases the likelihood of capturing entry opportunities that could not be captured with 【BODSOR】.
The figure below is a 5-minute chart of EURUSD.
EURUSD 5-minute chart (December 3, 2018)
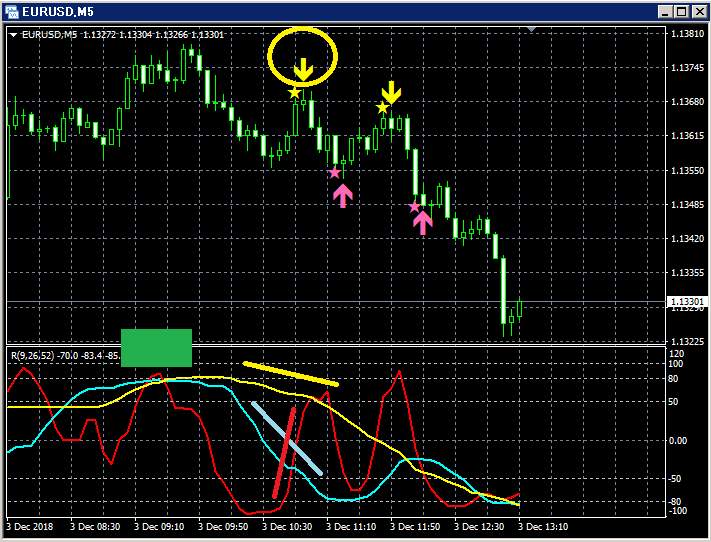
Top row:mBDSR
Among the three RCI lines, only RCI9 is clearly rising.
If RCI9 turns down, all three RCI lines may turn down together.
In other words, price may also fall sharply.
In such a situation, mBDSR’s pullback sell signal (yellow arrows circled) lights up.
This is a very common pattern close to a “three-way RCI top” where RCI9 briefly declines after rising.
This is a pattern where the signal lights up and the price subsequently declines smoothly.
The BODSOR sales page is
here.

Twitter
https://twitter.com/RCIX3Line
Blog
http://bodsor.blog.fc2.com/
Investment Navi+
https://fx-on.com/navi/serial/?id=359
YouTube
https://www.youtube.com/channel/UCL-g5uAlesiWVJEDtWlFvGw
Examples of pullback buy and pullback sell signals on USD/JPY 1-hour chart
※In the charts within this article, for convenience, there may be additions such as circles, lines, or rectangles drawn, so please note.


