

Trend reversal flow from the sign of "RCI3 Mono line + mBDSR" (USD/CHF 5-minute chart)
※Campaign is ongoing until January 10, 2019.
The sales page for BODSOR is here.
※ BODSOR is an indicator developed to improve entry accuracy when executing pullback buying or rally selling using three RCI lines (RCI3).
This time, an附加のインジケーター mBDSR has been included with 【BODSOR】.
【mBDSR】(the附加 indicator):
The development concept is the same as for 【BODSOR】, but the arrow signal generation conditions and its calculation method are completely different.
【BODSOR】よりも多くの矢印サインが発生するため、【BODSOR】ではとらえることの
できなかったエントリーチャンスをとらえることができる可能性が高まります。
The figure below shows the USD/CHF 5-minute chart.
USD/CHF 5-minute chart
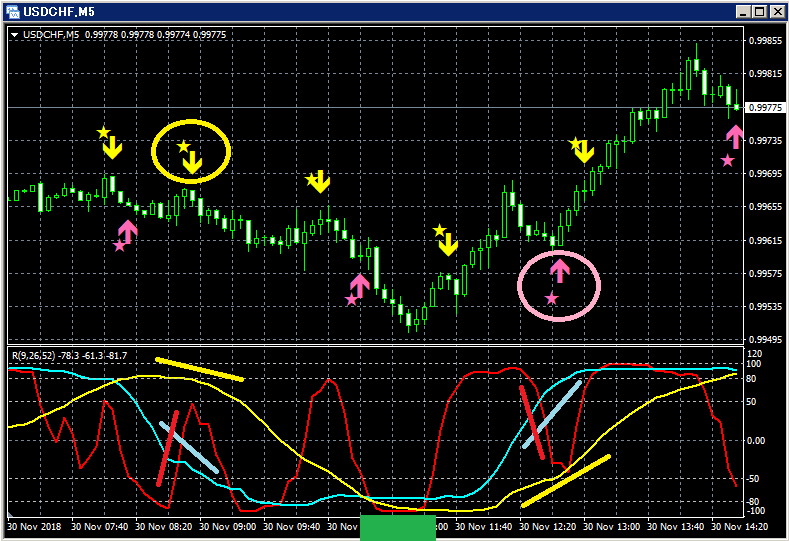
Upper row: mBDSR
(1) Buy on a pullback signal
Among the RCI3 lines, only RCI9 is clearly rising.
If RCI9 reverses downward, all three RCI lines may turn down,
meaning price could also fall strongly.
In such a scenario, the mBDSR pullback buy signal (yellow arrow circled) lights up.
Immediately after the signal lights, two bearish candles occur in succession, and thereafter price continues to fall smoothly, which is
evident.
(2) Approaching a formation close to a so-called “RCI3 triple bottom”
(3) Pullback buying
Among the RCI3 lines, only RCI9 is clearly declining.
If RCI9 reverses upward, all three RCI lines may turn upward,
meaning price could rise strongly.
In such a scenario, the mBDSR pullback buy signal (circled pink arrow) lights up.
This is a very common pattern where the price aims for a pullback after RCI9 rises from the so-called “RCI3 bottom.”
The BODSOR sales page is here.

https://twitter.com/RCIX3Line
Blog
http://bodsor.blog.fc2.com/
Investment Navi+
https://fx-on.com/navi/serial/?id=359
YouTube
https://www.youtube.com/channel/UCL-g5uAlesiWVJEDtWlFvGw
Examples of pullback buying and rising-selling signals on the USD/JPY 1-hour chart
※In the charts within this article, for convenience of explanation, you may see円 (yen), straight lines, or squares added,
so please understand.


