

【RCI3 single line + mBDSR】AUDUSD 1-hour chart example of a pullback sell signal
Campaign is ongoing until January 10, 2019.
The sales page for BODSOR (mBDSR) ishere.
BODSOR is an indicator developed to improve the entry accuracy when using three RCI lines for buy-the-dottom (pullback buying) or sell-the-rally (pullback selling).
This time, the bonus indicator 【mBDSR】 has been bundled with 【BODSOR】.
【mBDSR】(bonus indicator):
The development concept is the same as for 【BODSOR】, but the arrow-sign generation conditions and the calculation method are completely
different.
Since more arrow signs occur than with 【BODSOR】, there is a higher possibility of capturing entry opportunities that could not be captured with 【BODSOR】.
The figure below is the AUDUSD 1-hour chart.
AUDUSD 1-hour chart (November 29–30, 2018)
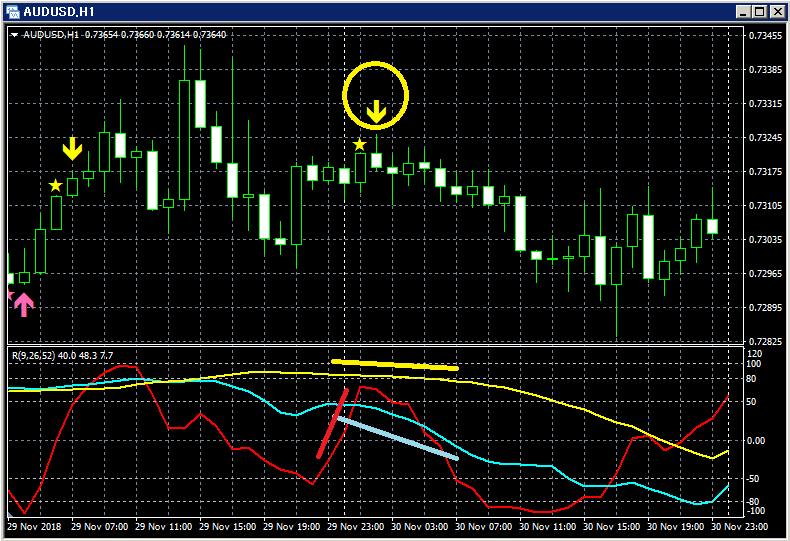
Top row:mBDSR
Among the three RCI lines, only RCI9 is clearly rising.
If RCI9 turns downward, all three RCI lines may turn downward simultaneously.
In other words, price may also fall strongly.
In such a situation,mBDSR's pullback selling signal (yellow arrow circled) lights up.
Immediately after the signal lights, two consecutive bearish candles appear, and prices continue to fall afterward.
This can be seen.
The sales page for BODSOR (mBDSR) ishere.

https://twitter.com/RCIX3Line
Blog
http://bodsor.blog.fc2.com/
Investment Navi+
https://fx-on.com/navi/serial/?id=359
YouTube
https://www.youtube.com/channel/UCL-g5uAlesiWVJEDtWlFvGw
Examples of pullback buying and sell-the-rally signals on the USD/JPY 1-hour chart
※Please note that in some charts within this article, for convenience, circles, straight lines, squares, etc. may be drawn.
Thank you for understanding.


