

[RCI3 Triple Line + mBDSR] AUDNZD Daily Chart Example of Retracement Sell Signal
※Campaign is ongoing until January 10, 2019.
The product page for BODSOR (mBDSR) ishere.
※ BODSOR is an indicator developed to improve entry accuracy when buying on dips or selling on rallies using the RCI3-line.
This time, the【BODSOR】includes a bonus indicator【mBDSR】.
【mBDSR】(Bonus indicator):
The development concept is the same as for【BODSOR】, but the arrow signal generation conditions and their calculation method are completely
different.
Because more arrow signals occur than with【BODSOR】, there is a higher possibility of capturing entry opportunities that could not be captured with【BODSOR】.
The figure below is a daily chart of AUDNZD.
AUDNZD Daily
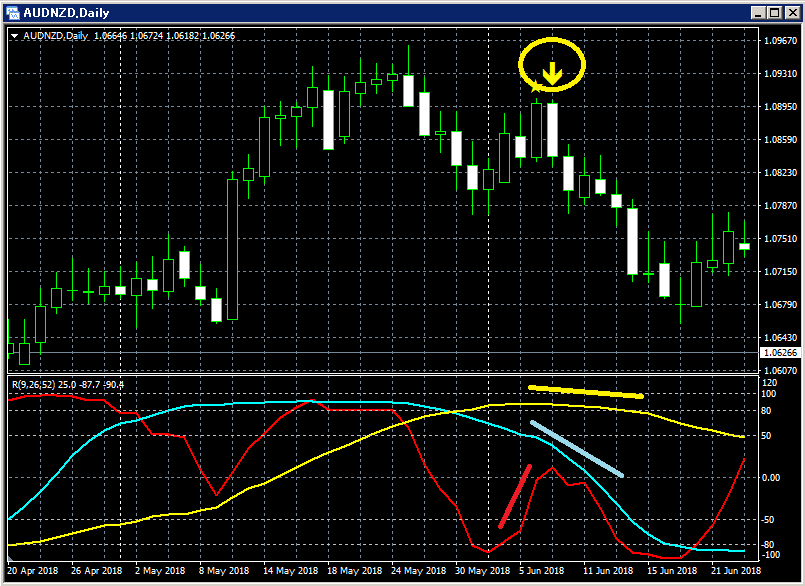
Upper row:mBDSR
Among the three RCI lines, only RCI9 is clearly rising.
If RCI9 reverses downward, all three RCI lines may turn downward.
In other words, the price may also fall strongly.
In such a situation,mBDSR’s pullback/sell signal (yellow arrows circled in circles) lights up.
Immediately after the signal lights, two solid bearish candles appear in succession, and the price continues to
fall smoothly.
The sales page for BODSOR (mBDSR) ishere.

Twitter
https://twitter.com/RCIX3Line
Blog
http://bodsor.blog.fc2.com/
Investment Navigator Plus
https://fx-on.com/navi/serial/?id=359
YouTube
https://www.youtube.com/channel/UCL-g5uAlesiWVJEDtWlFvGw
USD/JPY 1-hour chart: examples of pullback buying and rally selling signals
※In the charts in this article, for convenience,円 (yen) and lines or rectangles may be drawn added
for illustration purposes, so please understand.
× ![]()


