

【RCI3 Three-line + mBDSR】AUDCAD Daily Chart Example of a Pullback Sell Signal
※Campaign is ongoing until January 10, 2019.
The sales page for BODSOR (mBDSR) ishere.
※ BODSOR is an indicator developed to improve entry accuracy when buying on dips or selling on rallies using the RCI3-line.
This time, the bonus indicator【mBDSR】 is included with 【BODSOR】.
【mBDSR】(bonus indicator):
Its development concept is the same as【BODSOR】, but the arrow signal generation conditions and the calculation method are completely different.
As it generates more arrow signals than【BODSOR】, there is a higher possibility of capturing entry opportunities that could not be captured with【BODSOR】.
The figure below is a daily chart of AUDCAD.
AUDCAD Daily
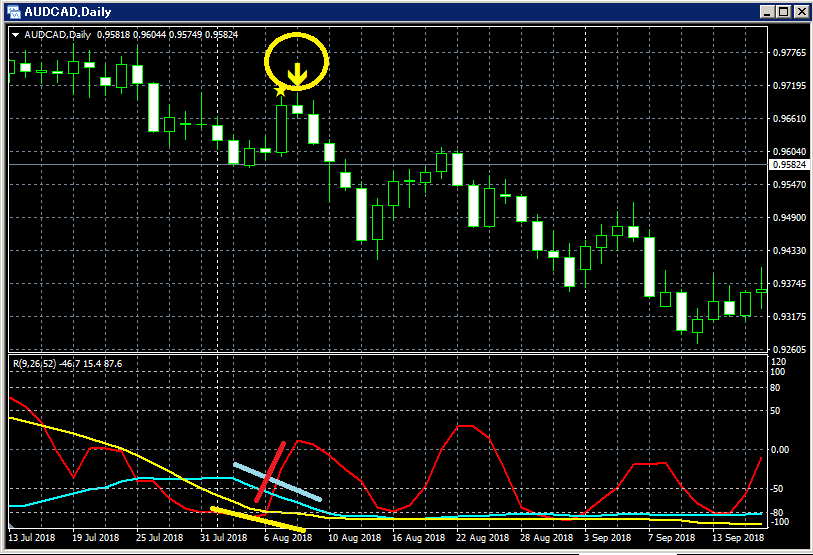
Upper part:mBDSR
Among the three RCI lines, only RCI9 is clearly rising.
If RCI9 reverses downward, the three RCIs may all turn downward.
In other words, price may undergo a strong decline.
In such a situation,mBDSR’s sell-on-rally signal (yellow arrows circled in a circle) lights up.
Immediately after the signal lights, five consecutive bearish candles appear, and thereafter price continues to fall smoothly.
It can be seen that.
Note that in this case, the reversal downward of the rising RCI9 is confirmed after two bearish candles appear.
BODSOR
(mBDSR) sales page ishere.

https://twitter.com/RCIX3Line
Blog
http://bodsor.blog.fc2.com/
Investment Navi+
https://fx-on.com/navi/serial/?id=359
YouTube
https://www.youtube.com/channel/UCL-g5uAlesiWVJEDtWlFvGw
Examples of buy on dips and sell on rallies in the USD/JPY 1-hour chart
※In this article’s charts, for convenience, there may be added circles, lines, squares, etc. Please understand.


