

An example of weekly trend reversal from the sign of "RCI3 Line + mBDSR" (EUR/JPY)
※Campaign is running until January 10, 2019.
The sales page for BODSOR (mBDSR) ishere.
BODSOR is an indicator developed to improve the entry accuracy when buying on dips or selling on rallies using the RCI three-line setup.
This time, a bonus indicator 【mBDSR】 is included with 【BODSOR】.
【mBDSR】 (bonus indicator):
Its development concept is the same as 【BODSOR】, but the arrow signal generation conditions and its calculation method are completely different.
Because more arrow signals occur than with 【BODSOR】, there is a higher possibility of capturing entry opportunities that could not be captured with 【BODSOR】.
The figure below is a weekly chart of EURJPY.
EURJPY Weekly
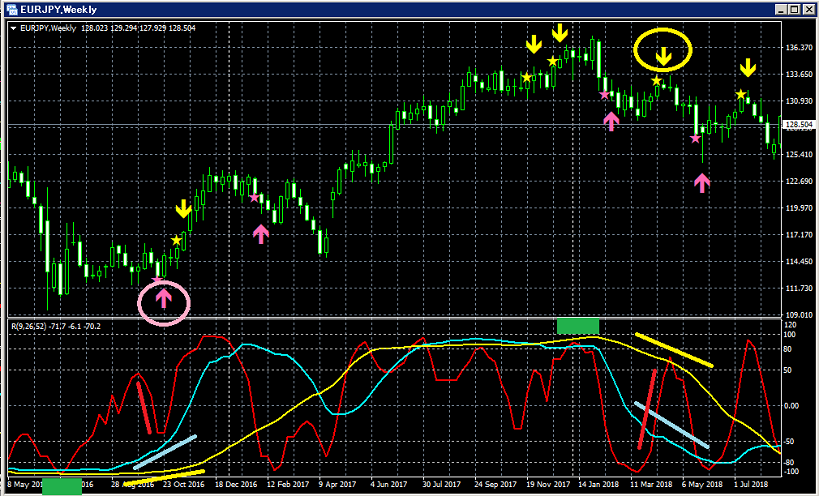
Upper row:mBDSR
Lower row: RCI three lines (red: RCI9, light blue: RCI26, yellow: RCI52)
(1) Buy on dip signal
Among the three RCI lines, only RCI9 is clearly trending down.
If RCI9 reverses upward, all three RCI lines may move upward, creating a possible buying opportunity.
In other words, price may rise strongly.
In such a situation,mBDSR’s buy-on-dip signal (pink arrows circled in a circle) lights up.
and it is clear that price will rise smoothly afterward.
This is a very common pattern where RCI forms a triple bottom and then RCI9 moves up again.
That is, aiming for a pullback after RCI9 has moved up from the triple bottom of RCI.
This is a very common pattern.
(2) Sell on rally signal
Among the three RCI lines, only RCI9 is clearly trending up.
If RCI9 reverses downward, all three RCI lines may move downward, creating a potential selling opportunity.
In other words, price may fall sharply.
In such a situation,mBDSR’s sell-on-rally signal (yellow arrows circled in a circle) lights up.
After the signal lights up, it is clear that price is plummeting.
This is the very common pattern of aiming for a pullback after RCI9 moves down from the so-called RCI triple top.It is a very common pattern.
Pattern.

Twitter
https://twitter.com/RCIX3Line
Blog
http://bodsor.blog.fc2.com/
Investment Navi+
https://fx-on.com/navi/serial/?id=359
YouTube
https://www.youtube.com/channel/UCL-g5uAlesiWVJEDtWlFvGw
Examples of dip buying and rally selling signals on the EUR/USD 1-hour chart
https://twitter.com/RCIX3Line
Blog
http://bodsor.blog.fc2.com/
Investment Navi+
https://fx-on.com/navi/serial/?id=359
YouTube
https://www.youtube.com/channel/UCL-g5uAlesiWVJEDtWlFvGw
Examples of dip buying and rally selling signals on the EUR/USD 1-hour chart
× ![]()


