

【RCI3 Three-Line + mBDSR】 EUR/JPY Weekly Chart Example of a Pullback Sell Signal
Campaign is ongoing until January 10, 2019.
The sales page for BODSOR (mBDSR) ishere.
BODSOR is an indicator developed to improve entry accuracy when buying on pullbacks or selling on rallies using the RCI3-line.
It was developed to enhance accuracy for such entries.
This time, a bonus indicator 【mBDSR】 has been included with 【BODSOR】.
【mBDSR】 (bonus indicator):
The development concept is the same as 【BODSOR】, but the arrow signal generation conditions and their calculation method are completely
different.
Because more arrow signals occur than with BODSOR, it increases the likelihood of catching entry opportunities that could not be captured with BODSOR.
The figure below is a weekly chart of the EUR/JPY.
EUR/JPY Weekly
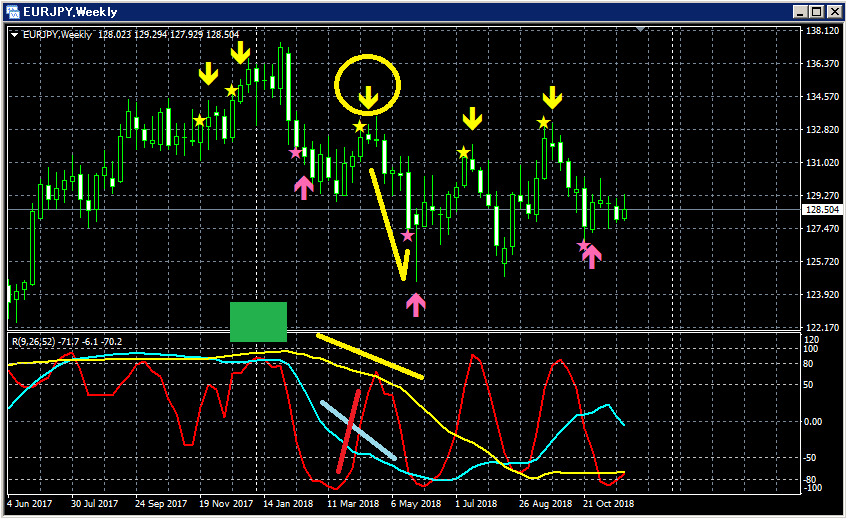
Top row:mBDSR
Only RCI9 among the three RCI lines is clearly rising.
If RCI9 turns down, all three RCI lines may turn down, indicating a possible strong price decline.
In other words, the price may also fall sharply.
In such a scenario,mBDSR’s pullback sell signal (yellow arrows circled in a circle) lights up.
Subsequently, the price drops sharply, as can be seen.
This is a very common pattern where the signal lights up during a rebound after the RCI3 triple-top situation and the RCI9 briefly declines.
A typical example of waiting for a signal after the temporary retreat.
The sales page for BODSOR (mBDSR) ishere.

Twitter
https://twitter.com/RCIX3Line
Blog
http://bodsor.blog.fc2.com/
Investment Navi+
https://fx-on.com/navi/serial/?id=359
YouTube
https://www.youtube.com/channel/UCL-g5uAlesiWVJEDtWlFvGw
Examples of pullbacks and pullback sales signals on the EUR/JPY 1-hour chart
※Note: In the charts within this article, for convenience of explanation,円 (yen) and lines or boxes may be drawn, so please understand.
Please be aware.


