

【RCI3 Three-line + mBDSR】 USD/JPY Daily Chart Retracement Sell Signal
Campaign is ongoing until January 10, 2019.
BODSOR sales page ishere.
BODSOR is an indicator developed to improve the entry accuracy when executing buy-the-dips or selling-rebounds using three RCI lines.This time, a bonus indicator 「mBDSR」 has been included with 【BODSOR】.
【mBDSR】 (bonus indicator):
The development concept is the same as 【BODSOR】, but the arrow signal generation conditions and its calculation method are completely different.
Because more arrow signals appear than with 【BODSOR】, there is a higher possibility of catching entry opportunities that 【BODSOR】 could not capture.
The figure below is the USD/JPY daily chart.
USD/JPY Daily
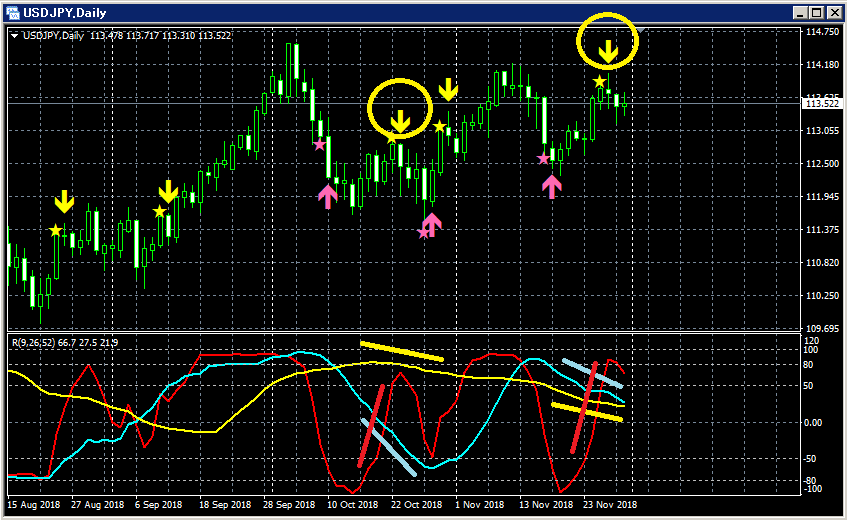
Upper row:mBDSR
Among the three RCI lines, only RCI9 is clearly rising.
If RCI9 turns down, the three RCI lines could all decline, potentially indicating a strong price drop.
In such a scenario, price could also fall sharply.
In such a situation,mBDSR’s retrace-sell signals (yellow arrows circled in circles) appeared once in October and once in November.
They lit up once each.
In both cases, a bearish candle appeared immediately after the signal.
BODSOR sales page ishere.

Twitter
https://twitter.com/RCIX3Line
Blog
http://bodsor.blog.fc2.com/
Investment Navi+
https://fx-on.com/navi/serial/?id=359
YouTube
https://www.youtube.com/channel/UCL-g5uAlesiWVJEDtWlFvGw
Example of buy-the-dip and sell-the-rally signals on USD/JPY 1-hour chart
※In the charts within this article, for the sake of explanation, yen marks, straight lines, and rectangles may be drawn, so please understand.


