

【RCI3 single line+mBDSR】EURAUD 4-hour chart example of pullback selling signal
※Campaign ongoing until January 10, 2019.
The sales page for BODSOR (mBDSR) ishere.
※ BODSOR is an indicator developed to improve entry accuracy when buying on dips or selling on rallies using the RCI3-line.
This time, a bonus indicator 【mBDSR】 has been bundled with 【BODSOR】.
【mBDSR】 (bonus indicator):
The development concept is the same as for 【BODSOR】, but the arrow signal generation conditions and its calculation method are completely
different.
Because more arrow signals are generated than with 【BODSOR】, there is a higher possibility of capturing entry opportunities that could not be caught with 【BODSOR】.
The figure below is the EURAUD 4-hour chart.
EUR AUD 4-hour chart
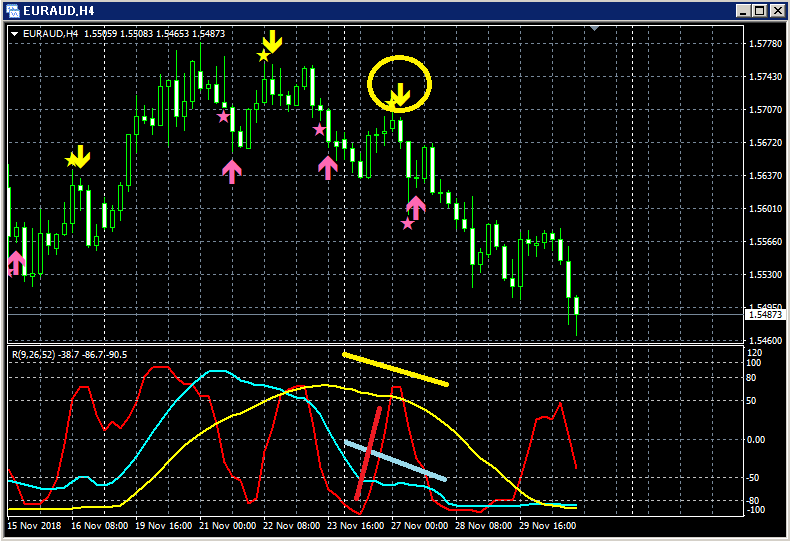
Upper panel:mBDSR
Lower panel: RCI three-line (Red: RCI9, Light blue: RCI26, Yellow: RCI52)
Among the three RCI lines, only RCI9 is clearly rising.
If RCI9 reverses and declines, all three RCIs may drop together.
In other words, prices may undergo a strong downtrend.
In such a situation, the mBDSR
Immediately after the signal lights up, two consecutive bearish candles appear, and prices continue to fall smoothly
thereafter.
Note that the reversal of the rising RCI9 is confirmed after two bearish candles have formed and updated to a new low.
.
BODSOR (mBDSR) sales page ishere.

Twitter
https://twitter.com/RCIX3Line
Blog
http://bodsor.blog.fc2.com/
Investment Navigator Plus
https://fx-on.com/navi/serial/?id=359
YouTube
https://www.youtube.com/channel/UCL-g5uAlesiWVJEDtWlFvGw
Example of push-type buying and retrace-selling signals on USD/JPY, 1-hour chart
※In the charts in this article, for readability, there may be added circles, lines, and rectangles to indicate explanations. Please understand.


