

[Today's USD/JPY Strategy] The moving averages we focus on, the rising (support) price, and the mBDSR (RCI two-filter) pullback sell signal
====================
【Special Video vol.01/Blacksun】
https://www.gogojungle.co.jp/info/22955
【Special Video vol.02/Blacksun】
https://www.gogojungle.co.jp/info/22956
【Special Video vol.03/Blacksun】
https://www.gogojungle.co.jp/info/22957
====================
The MT5 Beta Version has been released!!
mBDSR (Product ID 11836) Purchase Benefit】 MT5 Indicator (Beta) “mBDSR (Filterless, RCI Filter, MA Filter)”
https://www.gogojungle.co.jp/tools/indicators/56765
【Master RCI!! Trend Reversal, Buy the Dip, Sell on Pullbacks】
An indicator that shines in combination with RCI【BODSOR・mBDSR】
and methods & case studies (PDF) ★GogoJungle AWARD2020 Winner★
https://www.gogojungle.co.jp/tools/indicators/11836
MT5offers3-minute chartas standard.
USDJPY - USD/JPY 3-minute chart
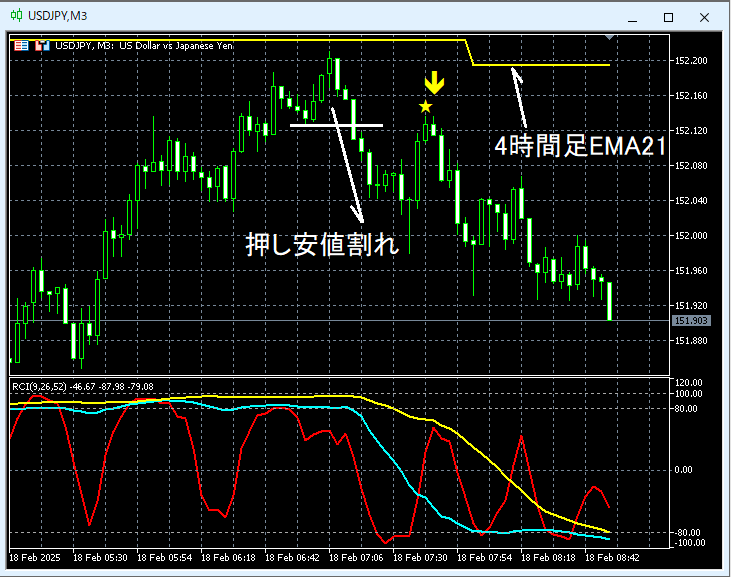
The higher timeframe context is omitted. Looking at the upper 3-minute chart, the key considerations here arethe 4-hour EMA21nearby, which is showing a slight rebound tendency. Andthe pressing lowbreak and subsequent risethe return sell signal of mBDSR (two RCI filters)lighting up and pushing the price lower.
From this example,it is evident how well a trading method that focuses on moving averages and Dow Theory works in harmony withthemBDSR signalsand their compatibility.
※Please note that in charts introduced in this article, for convenience of explanation, circles, lines, and squares may have been added.
An indicator that shines in combination with RCI【BODSOR・mBDSR】
and methods & case studies (PDF) ★GogoJungle AWARD2020 Winner★
https://www.gogojungle.co.jp/tools/indicators/11836
The PDF file comes with 358 documents (over 1,400 pages, over 470,000 characters).
Most of them are structured as cases where, by using three RCI lines to logically link higher and lower timeframes, multiple lower-timeframe situations are examined sequentially, ultimately waiting for a pullback buy or pullback sell timing (the mBDSR signal) on the lower timeframes.
Additionally,many focus on capturing points where multiple entry rationale overlap.There are also cases that explore how to assess upward or downward targets using three RCI lines.
In the descriptions within the PDF files,
more than 1,350 chartsare used.

【Special Video vol.01/Blacksun】
https://www.gogojungle.co.jp/info/22955
【Special Video vol.02/Blacksun】
https://www.gogojungle.co.jp/info/22956
【Special Video vol.03/Blacksun】
https://www.gogojungle.co.jp/info/22957
====================
The MT5 Beta Version has been released!!
mBDSR (Product ID 11836) Purchase Benefit】 MT5 Indicator (Beta) “mBDSR (Filterless, RCI Filter, MA Filter)”
https://www.gogojungle.co.jp/tools/indicators/56765
【Master RCI!! Trend Reversal, Buy the Dip, Sell on Pullbacks】
An indicator that shines in combination with RCI【BODSOR・mBDSR】
and methods & case studies (PDF) ★GogoJungle AWARD2020 Winner★
https://www.gogojungle.co.jp/tools/indicators/11836
MT5offers3-minute chartas standard.
USDJPY - USD/JPY 3-minute chart
The higher timeframe context is omitted. Looking at the upper 3-minute chart, the key considerations here arethe 4-hour EMA21nearby, which is showing a slight rebound tendency. Andthe pressing lowbreak and subsequent risethe return sell signal of mBDSR (two RCI filters)lighting up and pushing the price lower.
From this example,it is evident how well a trading method that focuses on moving averages and Dow Theory works in harmony withthemBDSR signalsand their compatibility.
※Please note that in charts introduced in this article, for convenience of explanation, circles, lines, and squares may have been added.
An indicator that shines in combination with RCI【BODSOR・mBDSR】
and methods & case studies (PDF) ★GogoJungle AWARD2020 Winner★
https://www.gogojungle.co.jp/tools/indicators/11836
The PDF file comes with 358 documents (over 1,400 pages, over 470,000 characters).
Most of them are structured as cases where, by using three RCI lines to logically link higher and lower timeframes, multiple lower-timeframe situations are examined sequentially, ultimately waiting for a pullback buy or pullback sell timing (the mBDSR signal) on the lower timeframes.
Additionally,many focus on capturing points where multiple entry rationale overlap.There are also cases that explore how to assess upward or downward targets using three RCI lines.
In the descriptions within the PDF files,
more than 1,350 chartsare used.
× ![]()


