

A weekly trend reversal example from the sign of "RCI3 Three-Line Plus mBDSR" (GBPUSD)
0
※Campaign available until January 10, 2019.
The BODSOR sales page ishere.
BODSOR is an indicator developed to improve entry accuracy when performing pullback buying or pullback selling using the RCI3-line.
This time, a bonus indicator 【mBDSR】 has been attached to 【BODSOR】.
【mBDSR】 (bonus indicator):
Its development concept is the same as 【BODSOR】, but the conditions for generating arrow signals and their calculation method are completely
different.
Because more arrow signals are generated than with 【BODSOR】, it is more likely to capture entry opportunities that could not be captured with 【BODSOR】.
The figure below is a weekly chart of GBP/USD.
GBP/USD Weekly
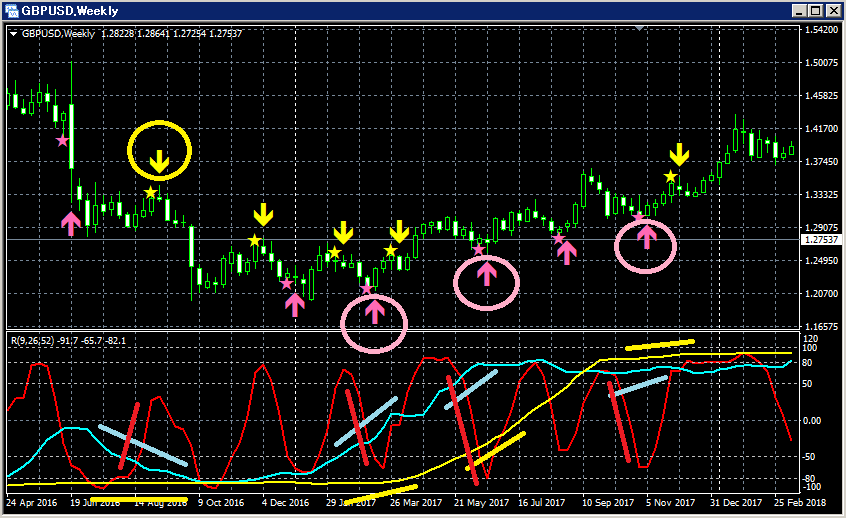
Upper panel:mBDSR
Lower panel: RCI3-line (Red: RCI9, Light blue: RCI26, Yellow: RCI52)
(1) Pullback selling signal
Among the three RCI lines, only RCI9 is clearly rising.
If RCI9 reverses and falls, all three RCI lines may turn down, indicating a potential strong downside in price.
In such a scenario,
mBDSR pullback selling signal (yellow circle arrow) lights up.
Immediately after the signal lights up, three large bearish candles appear in succession and the price falls sharply.
This shows the behavior clearly.
(2) Buy-on-dips signal
Among the three RCI lines, only RCI9 is clearly falling.
If RCI9 reverses and rises, all three RCI lines may turn up, indicating a potential strong upside in price.
In such a scenario,
mBDSR buy-on-dips signal (pink arrow circle) lights up several times.
In any of these buy-on-dips signals, the price subsequently rises steadily, which is evident.
The BODSOR sales page is
here.

Twitter
https://twitter.com/RCIX3Line
Blog
http://bodsor.blog.fc2.com/
Investment Navi+
https://fx-on.com/navi/serial/?id=359
YouTube
https://www.youtube.com/channel/UCL-g5uAlesiWVJEDtWlFvGw
Examples of pullback buying and pullback selling signals on the GBP/JPY 1-hour chart
※In the charts within this article, for convenience, circles, straight lines, and rectangles may have been added.
Please understand.
× ![]()


