

【RCI3 Three-line + mBDSR】Gold/USD Daily Chart Example of a Retracement Sell Signal
Campaign is ongoing until January 10, 2019.
BODSOR sales page ishere.
BODSOR is an indicator developed to improve the entry accuracy when making pullback buying or pullback selling using the RCI3-line.
to enhance the accuracy of entries when making pullback buys or pullback sells using the RCI3-line.
This time, a bonus indicator [mBDSR] has been included with 【BODSOR】.
【mBDSR】 (Bonus Indicator):
Its development concept is the same as 【BODSOR】, but the arrow signal triggering conditions and its calculation method are completely
different.
Because more arrow signals occur than with 【BODSOR】, there is a higher possibility of catching entry opportunities that could not be captured with 【BODSOR】.
The figure below is a daily chart of Gold/USD (XAUUSD).
Gold/USD (XAUUSD) Daily
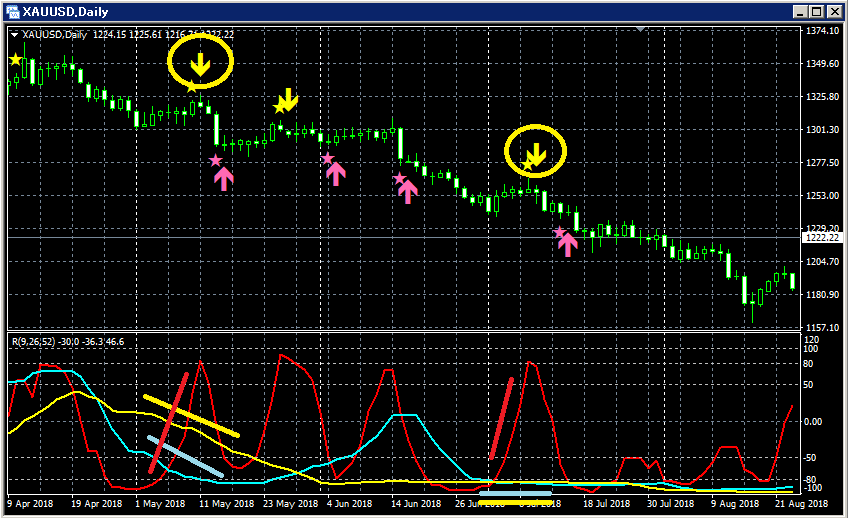
Upper row:mBDSR
Among the three RCI lines, only RCI9 is clearly rising.
If RCI9 reverses and declines, all three RCI lines may turn downward.
In other words, the price may also drop sharply.
In such a situation,mBDSR’s pullback sell signal (yellow arrows circled) lights up.
In the first signal, right after lighting, three consecutive bearish candles appear, and thereafter the price
continues to decline smoothly.
In the second signal, right after lighting, two consecutive bearish candles appear, and thereafter the price
continues to decline smoothly, as can be seen.
BODSOR sales page ishere.

Twitter
https://twitter.com/RCIX3Line
Blog
http://bodsor.blog.fc2.com/
Investment Navi +
https://fx-on.com/navi/serial/?id=359
YouTube
https://www.youtube.com/channel/UCL-g5uAlesiWVJEDtWlFvGw
USD/JPY 1-hour chart example of pullback buying and pullback selling signals
※In the charts within this article, for convenience, circles, lines, and squares may be drawn
as needed, so please forgive any such additions.


