

【RCI3 One-line + mBDSR】 Ripple / USD 1-hour timeframe Example of a pullback sell signal
Campaign is ongoing until January 10, 2019.
BODSOR sales pagehere.
BODSOR is an indicator developed to improve entry precision when buying on dips or selling on rallies using three RCI lines.
This time, a bonus indicator 【mBDSR】 has been included with 【BODSOR】.
【mBDSR】 (bonus indicator):
The development concept is the same as 【BODSOR】, but the arrow sign generation conditions and its calculation method are completely different.
Since more arrow signs are generated than in 【BODSOR】, there is a higher possibility of capturing entry opportunities that could not be captured with 【BODSOR】.
The figure below is the XRP/USD hourly chart.
XRP/USD (XRPUSD) hourly
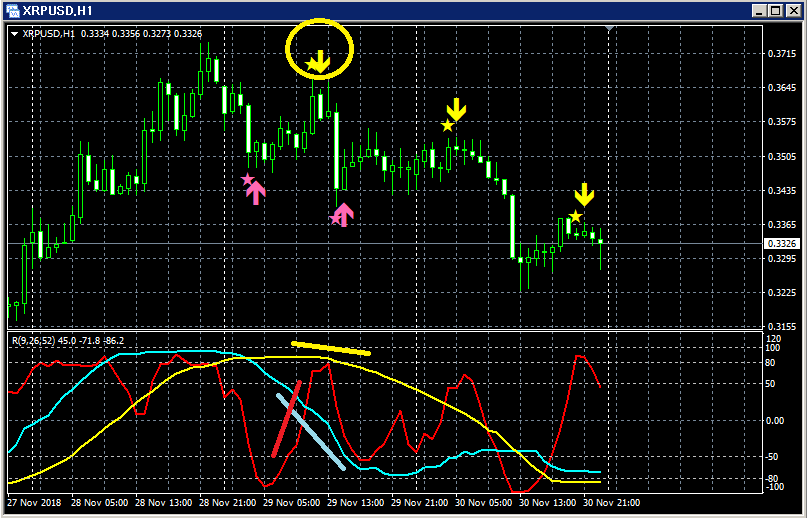
Top row: mBDSR
Bottom: RCI three-line (red: RCI9, light blue: RCI26, yellow: RCI52)Among the three RCI lines, only RCI9 is clearly rising.
If RCI9 turns downward, all three RCI lines may turn downward.
In other words, the price may experience a strong decline.
In such a scenario, the mBDSR sell-the-rally signal (yellow arrows circled in circles) lights up.
After the signal lights, the price continues to fall steadily, as is clear.
BODSOR sales pagehere.

Twitter
https://twitter.com/RCIX3Line
Blog
http://bodsor.blog.fc2.com/
InvestNavi+
https://fx-on.com/navi/serial/?id=359
YouTube
https://www.youtube.com/channel/UCL-g5uAlesiWVJEDtWlFvGw
Examples of push-back buying and pullback selling signals on USD/JPY hourly
※In the charts in this article, for convenience, circles, straight lines, and rectangles may have been added; please note this.


