

[RCI3 Three-Line Plus mBDSR] Ripple / USD 4-hour chart Example of a pullback selling signal
Campaign is ongoing until January 10, 2019.
BODSOR sales page is here.
BODSOR is an indicator developed to improve the entry accuracy when performing buy-the-dalls (catching tops) and selling on pullbacks using a 3-line RCI.
This time, a bonus indicator 【mBDSR】 has been included with 【BODSOR】.
【mBDSR】 (bonus indicator):
Its development concept is the same as 【BODSOR】, but the arrow signal generation conditions and its calculation method are completely different.
Since more arrow signals occur than with 【BODSOR】, there is a higher chance of capturing entry opportunities that could not be captured with 【BODSOR】.
The figure below is a 4-hour chart of XRP/USD (Ripple/US Dollar).
Ripple/USD (XRPUSD) 4-hour chart
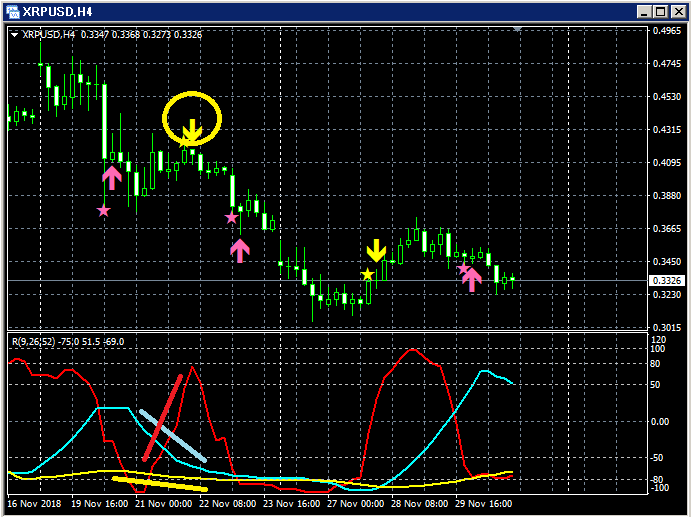
Top row:mBDSR
Bottom row: RCI three-line (red: RCI9, light blue: RCI26, yellow: RCI52)Among the three RCI lines, only RCI9 is clearly rising.
If RCI9 turns down, all three RCIs may turn down, indicating a potential strong price decline.
In other words, the price may fall sharply.
In such a scenario,mBDSR’s pullback/sell signal (yellow arrows circled) lights up.
Immediately after the signal lights, three consecutive bearish candles appear, and the price continues to fall smoothly thereafter
as can be seen.
BODSOR sales page is here.

Twitter
https://twitter.com/RCIX3Line
Blog
http://bodsor.blog.fc2.com/
Investment Navi+
https://fx-on.com/navi/serial/?id=359
YouTube
https://www.youtube.com/channel/UCL-g5uAlesiWVJEDtWlFvGw
USD/JPY 1-hour chart: examples of pullback buying and pullback selling signals
※In charts within this article, for convenience of explanation, there may be additions of circles, lines, rectangles, etc., so please note.


