

【RCI3 One-Line + mBDSR】NZDJPY 1-hour chart Example of a pullback buy signal
※Campaign is ongoing until January 10, 2019.
The BODSOR sales pageis here.
※ BODSOR is an indicator developed to improve entry precision when performing buy-on-pullbacks or sell-on-rebounds using the RCI 3-line.
This time, an extra indicator 【mBDSR】 has been attached to 【BODSOR】.
【mBDSR】 (the extra indicator):
Its development concept is the same as 【BODSOR】, but the arrow signal generation conditions and the calculation method are completely
different.
Because more arrow signals occur than with 【BODSOR】, the entry opportunities that could not be captured with 【BODSOR】 are more likely to be captured with 【mBDSR】.
The figure below is the 1-hour chart of NZDJPY.
NZDJPY 1-hour chart
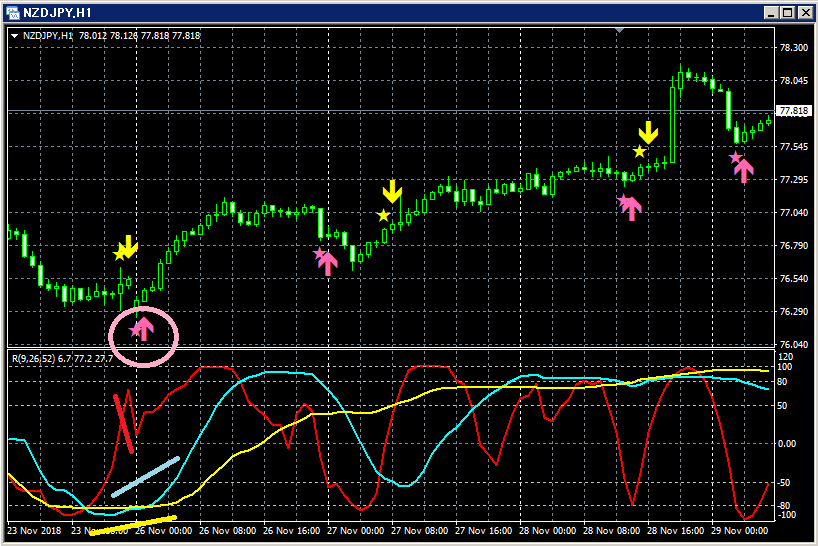
Upper row:mBDSR
Among the three RCI lines, only RCI9 is clearly declining.
If RCI9 turns up, all three RCI lines may rise together.
In other words, the price may rise strongly.
In such a situation,mBDSR’s pullback buying signal (pink arrows encircled) lights up.
Immediately after the signal lights up, six consecutive bullish candles appear, indicating that the price is rising smoothly.
The BODSOR sales pageis here.

Twitter
https://twitter.com/RCIX3Line
Blog
http://bodsor.blog.fc2.com/
Investment Navigator+
https://fx-on.com/navi/serial/?id=359
YouTube
https://www.youtube.com/channel/UCL-g5uAlesiWVJEDtWlFvGw
Examples of pullback buying and pullback selling signals on USD/JPY 1-hour chart
※In the charts within this article, for convenience of explanation, circles, lines, and rectangles may be drawn, so please understand.
.


