

An example of a monthly trend reversal from the sign of "RCI3 three-line + mBDSR" (AUD/JPY).
0
※Campaign is ongoing until January 10, 2019.
The sales page for BODSOR (mBDSR) ishere.
BODSOR is an indicator developed to improve entry precision when buying on dips or selling on rallies using the RCI 3-line.
This time, a bonus indicator 【mBDSR】 has been bundled with 【BODSOR】.
【mBDSR】 (Bonus Indicator):
The development concept is the same as for 【BODSOR】, but the arrow signal generation conditions and its calculation method are completely different.
Because more arrow signals occur than with 【BODSOR】, there is a higher likelihood of catching entry opportunities that could not be captured with 【BODSOR】.
It is an old chart, but the figure below is the AUD/JPY monthly chart.
AUD/JPY Monthly
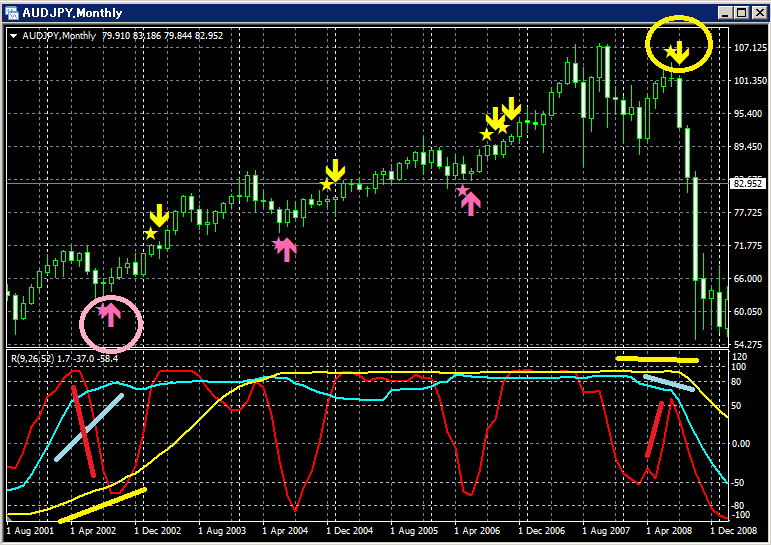
Top row:mBDSR
Bottom: RCI 3-line (Red: RCI9, Light Blue: RCI26, Yellow: RCI52)
(1) Buy-on-dip signal
Of the three RCI lines, only RCI9 clearly declines.
If RCI9 reverses upward, all three RCI lines may rise together.
In other words, the price may also rise strongly.
In such a moment,mBDSR Buy-on-dip signal (pink arrow circled) lights up.
Immediately after the signal lights, three consecutive bullish candles appear, and the price continues to rise afterward
, as can be seen.
(2) Sell-on-rally signal
Of the three RCI lines, only RCI9 clearly rises.
If RCI9 reverses downward, all three RCI lines may descend together.
In other words, the price may fall sharply.
In such a moment,mBDSR Sell-on-rally signal (yellow arrow circled) lights up.
Immediately after the signal lights, four large bearish candles appear in succession, and the price falls sharply.It can be seen.
This is a pattern where after the so-called RCI 3-peak, RCI9 briefly declines and then a return signal occurs.
BODSOR

Twitter
https://twitter.com/RCIX3Line
Blog
http://bodsor.blog.fc2.com/
Investment Navi+
https://fx-on.com/navi/serial/?id=359
YouTube
https://www.youtube.com/channel/UCL-g5uAlesiWVJEDtWlFvGw
Examples of buy-on-dip and sell-on-rally signals on the 1-hour chart of USD/JPY
※Please note that in charts within this article, for convenience of explanation, elements such as circles, straight lines, and squares may be drawn.
Thank you for your understanding.
× ![]()


