

[RCI3 Three-line + mBDSR] USD/CHF Daily Chart: Example of a pullback buying signal
0
※Campaign is ongoing until January 10, 2019.
The BODSOR sales page ishere.
※ BODSOR is an indicator developed to improve the entry accuracy when performing buying on dips or selling on rallies using the three-line RCI.
This time, an extra indicator 【mBDSR】 has been included with 【BODSOR】.
【mBDSR】 (extra indicator):
The development concept is the same as for 【BODSOR】, but the arrow signal generation conditions and their calculation method are completely
different.
Because more arrow signals occur than with BODSOR, the opportunities for entering that could not be captured with BODSOR
may be captured more frequently.
The figure below is the USD/CHF daily chart.
USD/CHF Daily
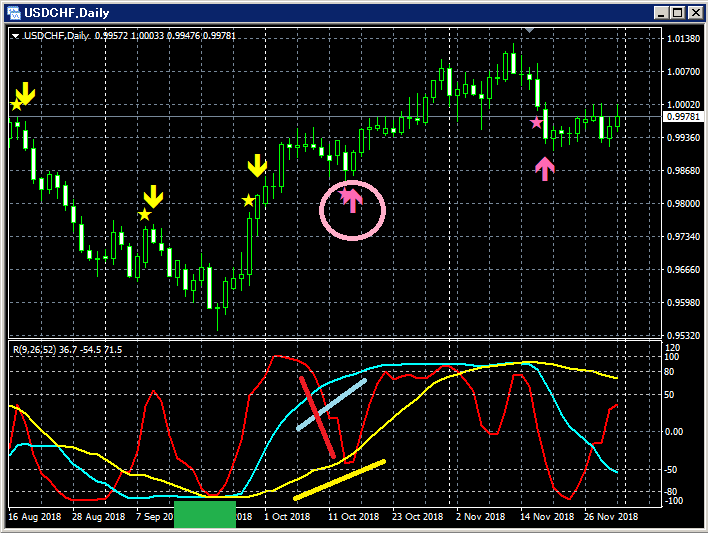
Top row:mBDSR
Bottom: RCI three lines (red: RCI9, light blue: RCI26, yellow: RCI52)
Of the three RCI lines, only RCI9 is clearly declining.
If RCI9 reverses upward, all three RCI lines may rise together.
In other words, price has a high potential to rise strongly.
In such a scenario,mBDSR’s dip-buy signal (pink arrow circled) lights up.
Immediately after the signal lights, five bullish candles appear in succession, indicating that price is rising smoothly.
It can be seen that this is a common pattern to target a dip after a temporary rise from an RCI three-line bottom to RCI9.
This is a very common pattern where the price dips after RCI9 rises from an “RCI triple bottom.”

Twitter
https://twitter.com/RCIX3Line
Blog
http://bodsor.blog.fc2.com/
Investment Navi+
https://fx-on.com/navi/serial/?id=359
YouTube
https://www.youtube.com/channel/UCL-g5uAlesiWVJEDtWlFvGw
Example of dip-buying and selling-on-rallies signals on the USD/JPY 1-hour chart
※The charts in this article may have added circles, lines, or boxes for convenience of explanation, so please understand.
× ![]()


