

[RCI3 Three-line + mBDSR] NZDUSD 15-minute chart Example of a pullback sell signal
※Campaign running until January 10, 2019.
The BODSOR sales page ishere.
※ BODSOR is an indicator developed to improve the entry accuracy when performing pullbacks and pullbacks using the RCI three-line setup.
This time, a bonus indicator 【mBDSR】 has been included with 【BODSOR】.
【mBDSR】 (bonus indicator):
The development concept is the same as 【BODSOR】, but the arrow signal generation conditions and its calculation method are completely different.
Since more arrow signals occur than with 【BODSOR】, there is a higher possibility of capturing entry opportunities that could not be captured with 【BODSOR】.
The figure below is a 15-minute chart of NZDUSD.
NZDUSD 15-minute chart
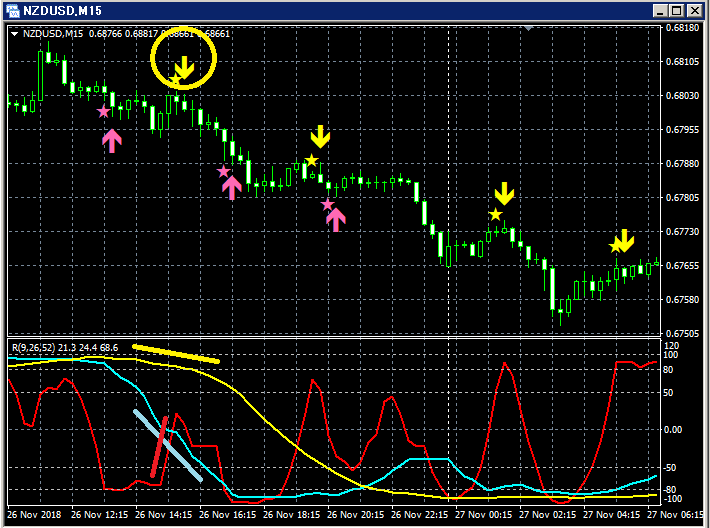
Top row:mBDSR
Bottom row: RCI three lines (red: RCI9, light blue: RCI26, yellow: RCI52)Among the three RCI lines, only RCI9 is clearly rising.
If RCI9 turns downward, all three RCIs may fall together in a bearish scenario.
In other words, price may also drop sharply.
In such a situation,mBDSR’s pullback sell signal (yellow arrow circled) lights up.
From right after the signal lights, price is clearly moving downward.
The BODSOR sales page ishere.

Twitter
https://twitter.com/RCIX3Line
Blog
http://bodsor.blog.fc2.com/
Invest Navi+
https://fx-on.com/navi/serial/?id=359
YouTube
https://www.youtube.com/channel/UCL-g5uAlesiWVJEDtWlFvGw
Example of pullback buying and pullback selling signals on the USD/JPY 1-hour chart
※In the charts within this article, for convenience of explanation, please note that yen marks, straight lines, and rectangles may be drawn.
ご了承ください。


