

【RCI3 Straight Lines + mBDSR】NZDUSD 4-hour Chart Example of a Pullback Sell Signal
※Campaign is ongoing until January 10, 2019.
The sales page for BODSORhere.
BODSOR is an indicator developed to improve the entry accuracy when executing buy-the-dip or sell-into-retracements using three RCI lines.
to improve entry accuracy when using three RCI lines for buying on dips or selling on rallies.
This time, an extra indicator 【mBDSR】 has been bundled with 【BODSOR】.
【mBDSR】 (the bonus indicator):
While the development concept is the same as 【BODSOR】, the arrow signal generation conditions and the calculation method are completely different.
Because more arrow signals occur than with BODSOR, there is a higher possibility of capturing entry opportunities that were not captured by BODSOR.
The chart below is the 4-hour chart of NZDUSD.
NZDUSD 4-hour chart
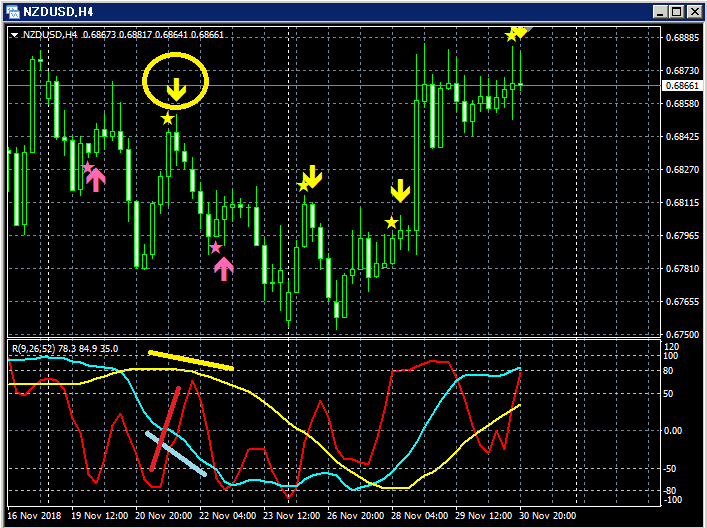
Top row:mBDSR
Only RCI9 among the three RCI lines is clearly rising.
If RCI9 turns down, all three RCIs may turn down, indicating a potential strong price decline.
In other words, there is a high possibility of a strong price drop.
In such a situation,mBDSR's pullback sell signal (yellow arrows circled) lights up.
Immediately after the signal lights, five consecutive bearish candles appear, indicating that the price is declining smoothly.
The sales page for BODSORhere.
Twitter
https://twitter.com/RCIX3Line
Blog
http://bodsor.blog.fc2.com/
Investment Navi+
https://fx-on.com/navi/serial/?id=359
YouTube
https://www.youtube.com/channel/UCL-g5uAlesiWVJEDtWlFvGw
Example of Buy-on-Dip and Sell-on-Rally signals for USD/JPY the 1-hour chart
※In this article's charts, for convenience, you may see added circles, lines, and rectangles.
Please understand.


