

[MT5 Version RCI攻略!!] Gold: Previous high, counter-trend line, and mBDSR retracement sell signal on higher timeframes
0
【MT5 Version Beta】 has been released!!
mBDSR (Product ID 11836) Purchase Bonus】 MT5 version Indicator (Beta) "mBDSR (no filters, RCI filter, MA filter)"
https://www.gogojungle.co.jp/tools/indicators/56765
【Master RCI!! Trend reversal, Buy the dips, Sell on rallies】
An indicator that shines when combined with RCI:【BODSOR・mBDSR】
and methodology / case studies (PDF) ★GogoJungle AWARD2020 Recipient★
https://www.gogojungle.co.jp/tools/indicators/11836
MT5 has12-minute chart is provided as standard.
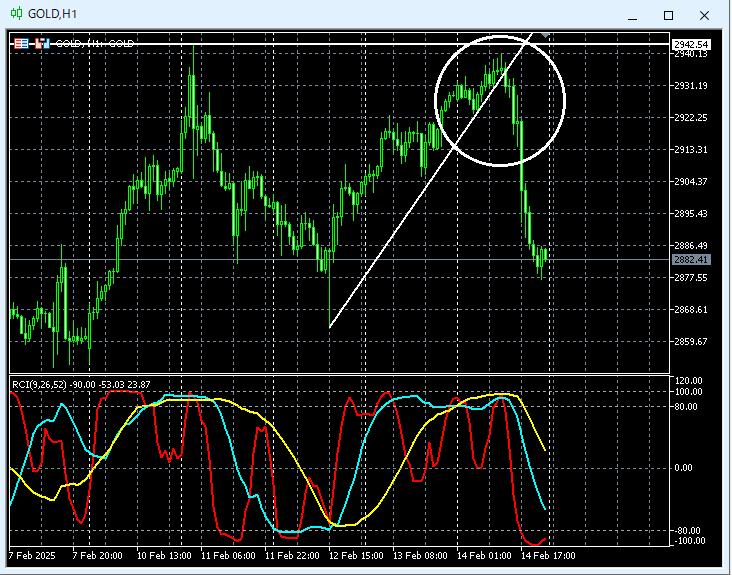
Gold XAUUSD 1-hour chart
Gold XAUUSD 12-minute chart
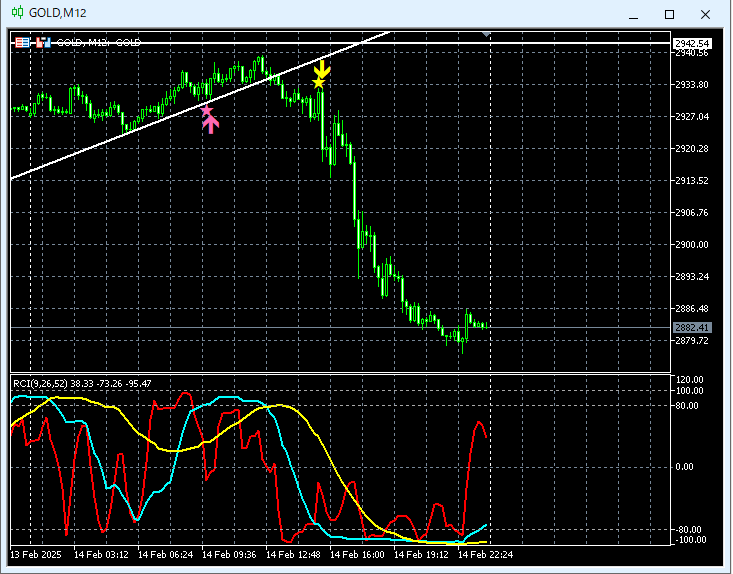
On the 12-minute chart above,the previous high on the higher timeframeis near a pullback.Counter-trend lineAfter breaking below, the risemBDSR (two RCI filters) Sell signallights up and the price drops significantly.
From this example,there is a strong synergy between trades focusing on double tops, previous highs, or counter-trend linesandmBDSR signals.
※Note: In this article, charts may include extra drawings such as circles, lines, or boxes for explanatory convenience.
An indicator that shines when combined with RCI【BODSOR・mBDSR】
and methodology / case studies (PDF) ★GogoJungle AWARD2020 Recipient★
https://www.gogojungle.co.jp/tools/indicators/11836
The PDF file contains 358 files (over 1,400 pages, over 470,000 words).
Many of these areexamples that logically link the higher and lower timeframes using three RCI lines to assess the status of multiple lower timeframes, ultimately waiting for buy-the-dips or sell-the-rallies on the lower timeframe (i.e., the mBDSR signals)..
Additionally,there are many entries focused on identifying overlapping entry reasons..
Furthermore,there are methods that explore targets for upside and downside using three RCI lines..
In the PDF explanations,there are over 1,350 charts used..

× ![]()


