

【RCI3 本ライン+ mBDSR】 AUDUSD 1-hour chart Example of a pullback buy signal
※Campaign ongoing until January 10, 2019.
The BODSOR sales page ishere.
BODSOR is an indicator developed to improve entry accuracy when performing buy-the-dip or sell-the-rally using a trio of RCI lines.
to highmagnitudeandprecision.
This time, an extra indicator 【mBDSR】 has been bundled with 【BODSOR】.
【mBDSR】 (the bonus indicator):
The development concept is the same as【BODSOR】, but the arrow signal triggering conditions and their calculation method are completely different.
They are entirely different.
Because more arrow signals occur than with 【BODSOR】, there is a higher possibility of capturing entry opportunities that could not be captured with 【BODSOR】.
The figure below is the AUDUSD 1-hour chart.
AUDUSD 1-hour chart
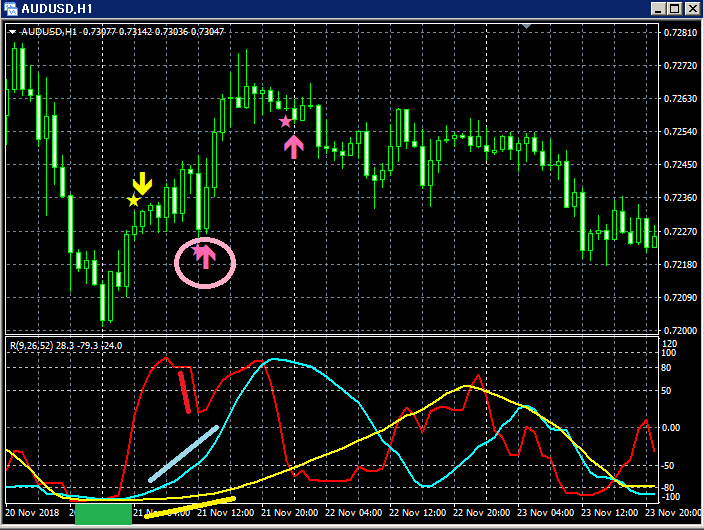
Upper row:mBDSR
Of the three RCI lines, only RCI9 is clearly declining.
If RCI9 reverses and rises, there is a possibility that all three RCIs will rise.
In other words, the price may rise strongly.
In such a situation, the mBDSR buy-the-dip signal (pink arrow encircled) lights up.
Immediately after the signal lights, three solid bullish candles appear, and it is clear that the price is rising steadily.
The BODSOR sales page ishere.

https://twitter.com/RCIX3Line
Blog
http://bodsor.blog.fc2.com/
Investment Navi+
https://fx-on.com/navi/serial/?id=359
YouTube
https://www.youtube.com/channel/UCL-g5uAlesiWVJEDtWlFvGw
Examples of push-back buying and pullback selling signals on USD/JPY 1-hour chart
※Note: In charts within this article, for convenience of explanation, yen marks, straight lines, and rectangles may be drawn, so please understand.


