

[RCI3 Three-Line + mBDSR] EURUSD 1-hour timeframe Example of a retracement sell signal
Campaign is ongoing until January 10, 2019.
The BODSOR sales page is here.
BODSOR is an indicator developed to improve the entry accuracy when performing buy-the-dip or sell-the-rally using the RCI three-line setup.
It was developed to enhance entry precision.
This time, a bonus indicator【mBDSR】is included with 【BODSOR】.
【mBDSR】 (Bonus Indicator):
The development concept is the same as for 【BODSOR】, but the arrow signal generation conditions and their calculation are completely different.
Because more arrow signals occur than with BODSOR, there is a higher chance to capture entry opportunities that could not be captured by BODSOR.
The figure below is the EUR/USD 1-hour chart.
EUR/USD 1-hour chart
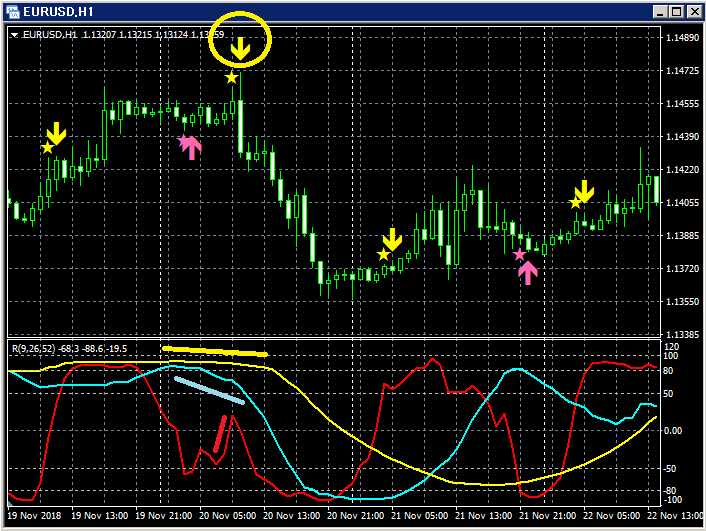
Top row:mBDSR
Bottom: RCI three-line (red: RCI9, light blue: RCI26, yellow: RCI52)Among the three RCI lines, only RCI9 is clearly rising.
If RCI9 reverses and declines, all three RCIs may descend, creating a possible scenario for strong price decline.
In other words, there is a possibility of a strong price drop.
In such a scenario,mBDSR’s pullback/sell signal (yellow arrows circled in circles) lights up.
Immediately after the signal lights, a large bearish candle appears, and price continues to fall smoothly thereafter.
This shows that.
The BODSOR sales page is here.

https://twitter.com/RCIX3Line
Blog
http://bodsor.blog.fc2.com/
Invest Navi Plus
https://fx-on.com/navi/serial/?id=359
YouTube
https://www.youtube.com/channel/UCL-g5uAlesiWVJEDtWlFvGw
Examples of buy the dip and pullback/sell signals on EUR/USD 1-hour chart
※Note: In this article's charts, for convenience, circles, lines, and rectangles may be drawn to help explanation. Please understand.


