

[MT5 Version] Notable Lows, Double Top, and mBDSR (RCI 2-Filters) Sell Signal on Higher Timeframe
0
============
【Special Video vol.01/Blacksun】
https://www.gogojungle.co.jp/info/22955
【Special Video vol.02/Blacksun】
https://www.gogojungle.co.jp/info/22956
【Special Video vol.03/Blacksun】
https://www.gogojungle.co.jp/info/22957
============
The MT5 version Beta has been released!!
mBDSR (Product ID 11836) Purchase Bonus: MT5 Indicator (Beta) “mBDSR (No Filter, RCI Filter, MA Filter)”
https://www.gogojungle.co.jp/tools/indicators/56765
【Master RCI!! Trend Reversal, Buy the Dip, Sell on Retracements】
An indicator that shines in combination with RCI: 【BODSOR・mBDSR】
and methodology / case studies (PDF) ★GogoJungle AWARD2020 Winner★
https://www.gogojungle.co.jp/tools/indicators/11836
MT5 includes10-minute chart as standard.
Dollar/Yen USDJPY 10-minute chart
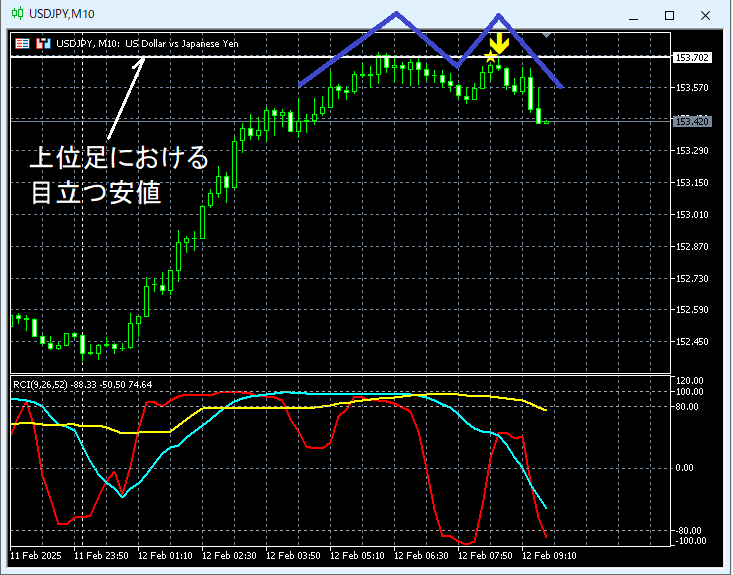
Looking at the 10-minute chart above,a prominent low on the higher timeframenearbyforms a double topand declines.mBDSR (RCI two-filter) overbought/sell signalcaptures the timing of the start of the decline on the right peak of the double top.
From this example,a trading method focusing on prominent lows and double topsandthe signals of mBDSRshow a high degree of compatibility.
※ Please note that in the charts introduced in this article, for convenience of explanation, circles, straight lines, and rectangles may be drawn.
An indicator that shines in combination with RCI: 【BODSOR・mBDSR】
and methodology / case studies (PDF) ★GogoJungle AWARD2020 Winner★
https://www.gogojungle.co.jp/tools/indicators/11836
The PDF file includes 358 files (over 1,400 pages, over 470,000 characters).
Most of them are examples that break down the timing of dips or pullbacks in the lower timeframes by logically linking higher and lower timeframes using three RCI lines, and waiting for the timing of dips or pullbacks in the lower timeframes (i.e., the mBDSR signal).
Also,many of them focus on identifying points where multiple entry criteria converge.There are also many that explore potential upside/downside targets using three RCI lines.
In addition,the descriptions include methods to explore upside and downside targets using three RCI lines.Also included.
In the PDF files,more than 1,350 chartsare used.

【Special Video vol.01/Blacksun】
https://www.gogojungle.co.jp/info/22955
【Special Video vol.02/Blacksun】
https://www.gogojungle.co.jp/info/22956
【Special Video vol.03/Blacksun】
https://www.gogojungle.co.jp/info/22957
============
The MT5 version Beta has been released!!
mBDSR (Product ID 11836) Purchase Bonus: MT5 Indicator (Beta) “mBDSR (No Filter, RCI Filter, MA Filter)”
https://www.gogojungle.co.jp/tools/indicators/56765
【Master RCI!! Trend Reversal, Buy the Dip, Sell on Retracements】
An indicator that shines in combination with RCI: 【BODSOR・mBDSR】
and methodology / case studies (PDF) ★GogoJungle AWARD2020 Winner★
https://www.gogojungle.co.jp/tools/indicators/11836
MT5 includes10-minute chart as standard.
Dollar/Yen USDJPY 10-minute chart
Looking at the 10-minute chart above,a prominent low on the higher timeframenearbyforms a double topand declines.mBDSR (RCI two-filter) overbought/sell signalcaptures the timing of the start of the decline on the right peak of the double top.
From this example,a trading method focusing on prominent lows and double topsandthe signals of mBDSRshow a high degree of compatibility.
※ Please note that in the charts introduced in this article, for convenience of explanation, circles, straight lines, and rectangles may be drawn.
An indicator that shines in combination with RCI: 【BODSOR・mBDSR】
and methodology / case studies (PDF) ★GogoJungle AWARD2020 Winner★
https://www.gogojungle.co.jp/tools/indicators/11836
The PDF file includes 358 files (over 1,400 pages, over 470,000 characters).
Most of them are examples that break down the timing of dips or pullbacks in the lower timeframes by logically linking higher and lower timeframes using three RCI lines, and waiting for the timing of dips or pullbacks in the lower timeframes (i.e., the mBDSR signal).
Also,many of them focus on identifying points where multiple entry criteria converge.There are also many that explore potential upside/downside targets using three RCI lines.
In addition,the descriptions include methods to explore upside and downside targets using three RCI lines.Also included.
In the PDF files,more than 1,350 chartsare used.
× ![]()


