

[MT5 Version] Important Moving Averages to Watch, Double Top, and mBDSR (RCI two-filter) Sell Signal on Retracement
0
========================
【Special Video vol.01/Blacksun】
https://www.gogojungle.co.jp/info/22955
【Special Video vol.02/Blacksun】
https://www.gogojungle.co.jp/info/22956
【Special Video vol.03/Blacksun】
https://www.gogojungle.co.jp/info/22957
========================
The MT5 version Beta has been released!!
mBDSR (Product ID 11836) Purchase Bonus】MT5 Indicator for the Beta version “mBDSR (No filter, RCI filter, MA filter)”
https://www.gogojungle.co.jp/tools/indicators/56765
【Master RCI!! Trend reversal, Buy the Dip, Sell on Rallies】
Indicator that excels when used in combination with RCI【BODSOR・mBDSR】
and techniques & case studies (PDF) ★GogoJungle AWARD2020 winner★
https://www.gogojungle.co.jp/tools/indicators/11836
MT5includes6-minute chartas standard.
AUD/JPY 6-minute chart
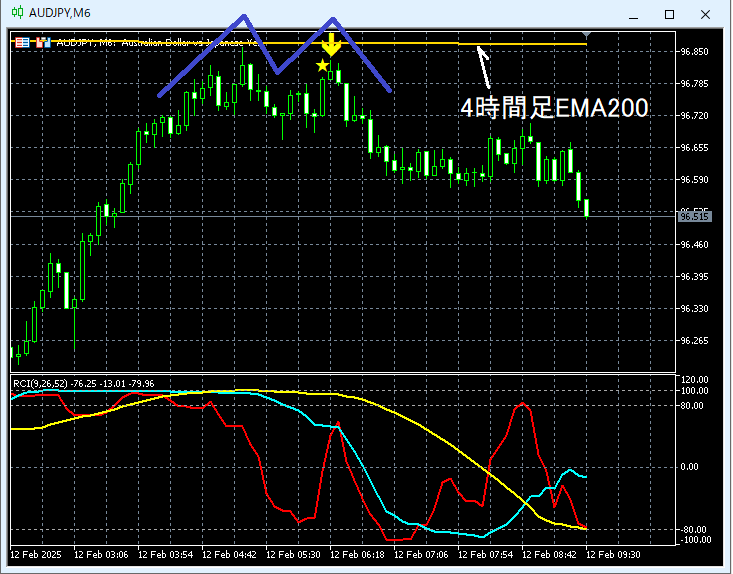
Looking at the 6-minute chart above,near the 200 EMA on the 4-hour chartthere isa double topand it is declining.mBDSR (RCI two-filter) pullback sell signalistimely as the decline begins on the right-side peak of the double topas seen here.
From this example,there is a high synergy between trading methods that focus on moving averages and double topsandthe signals of mBDSR.
※Please note that in the charts shown in this article, for convenience of explanation, circles, straight lines, and rectangles may be drawn.
Indicator that excels when used in combination with RCI【BODSOR・mBDSR】
and techniques & case studies (PDF) ★GogoJungle AWARD2020 winner★
https://www.gogojungle.co.jp/tools/indicators/11836
The PDF file includes 358 documents (over 1,400 pages, over 470,000 words in total).
Most of them are about observing the status of multiple lower timeframes step by step by linking higher and lower timeframes logically using three RCI lines, ultimately waiting for pullbacks or rallies (i.e., mBDSR signals) on the lower timeframe.
Additionally,there are many that focus on identifying points where multiple entry justifications overlap.It also includes methods to explore upside and downside targets using three RCI lines.
In the description of the PDF file,
more than 1,350 chartsare used.

【Special Video vol.01/Blacksun】
https://www.gogojungle.co.jp/info/22955
【Special Video vol.02/Blacksun】
https://www.gogojungle.co.jp/info/22956
【Special Video vol.03/Blacksun】
https://www.gogojungle.co.jp/info/22957
========================
The MT5 version Beta has been released!!
mBDSR (Product ID 11836) Purchase Bonus】MT5 Indicator for the Beta version “mBDSR (No filter, RCI filter, MA filter)”
https://www.gogojungle.co.jp/tools/indicators/56765
【Master RCI!! Trend reversal, Buy the Dip, Sell on Rallies】
Indicator that excels when used in combination with RCI【BODSOR・mBDSR】
and techniques & case studies (PDF) ★GogoJungle AWARD2020 winner★
https://www.gogojungle.co.jp/tools/indicators/11836
MT5includes6-minute chartas standard.
AUD/JPY 6-minute chart
Looking at the 6-minute chart above,near the 200 EMA on the 4-hour chartthere isa double topand it is declining.mBDSR (RCI two-filter) pullback sell signalistimely as the decline begins on the right-side peak of the double topas seen here.
From this example,there is a high synergy between trading methods that focus on moving averages and double topsandthe signals of mBDSR.
※Please note that in the charts shown in this article, for convenience of explanation, circles, straight lines, and rectangles may be drawn.
Indicator that excels when used in combination with RCI【BODSOR・mBDSR】
and techniques & case studies (PDF) ★GogoJungle AWARD2020 winner★
https://www.gogojungle.co.jp/tools/indicators/11836
The PDF file includes 358 documents (over 1,400 pages, over 470,000 words in total).
Most of them are about observing the status of multiple lower timeframes step by step by linking higher and lower timeframes logically using three RCI lines, ultimately waiting for pullbacks or rallies (i.e., mBDSR signals) on the lower timeframe.
Additionally,there are many that focus on identifying points where multiple entry justifications overlap.It also includes methods to explore upside and downside targets using three RCI lines.
In the description of the PDF file,
more than 1,350 chartsare used.
× ![]()


