

[MT5 Version] Double Bottom, Counter-Trend Line, and mBDSR (RCI two-line filter) Buy Signal
==============================
【Special Video vol.01/Blacksun】
https://www.gogojungle.co.jp/info/22955
【Special Video vol.02/Blacksun】
https://www.gogojungle.co.jp/info/22956
【Special Video vol.03/Blacksun】
https://www.gogojungle.co.jp/info/22957
==============================
The MT5 Beta Version has been released!!
mBDSR (Product ID 11836) Purchase Bonus】MT5 Indicator (Beta) “mBDSR (No filter, RCI filter, MA filter)”
https://www.gogojungle.co.jp/tools/indicators/56765
【Master RCI!! Trend reversal, dip buying, pullback selling】
An indicator with strong synergy when combined with RCI【BODSOR・mBDSR】
and methods・case studies (PDF) ★GogoJungle AWARD2020 Winner★
https://www.gogojungle.co.jp/tools/indicators/11836
MT5 offers20-minute chart as the standard.
AUDJPY 20-minute chart
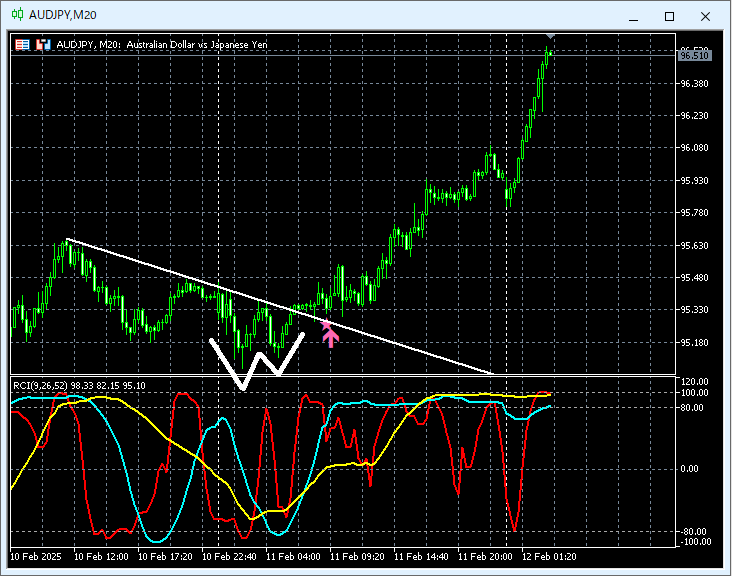
Looking at the 3-minute chart above,a counter-trend lineis broken to the upside, and thena double bottomis formed, and on the subsequent declinethe mBDSR (RCI two-filter) dip-buy signallights up, and the price rises firmly.
From this example,the trading approach focusing on counter-trend lines and double bottomsandthe signals of mBDSRshow a high degree of compatibility.
※For readability, some charts in this article may have circles, lines, or boxes added.
Indicators with strong synergy when combined with RCI【BODSOR・mBDSR】
and methods・case studies (PDF) ★GogoJungle AWARD2020 Winner★
https://www.gogojungle.co.jp/tools/indicators/11836
The PDF file includes 358 files (over 1,400 pages, over 470,000 words).
Many of these are summarizing how to logically link higher and lower timeframes using three RCI lines to progressively analyze multiple lower timeframes, ultimately waiting for pullbacks or pullback buys on the lower timeframes (the mBDSR signals).
Additionally,many focus on identifying points where multiple entry rationales overlap.There are also many sections that explore using three RCI lines to identify targets for both upward and downward movement.
In the PDF explanations,
over 1,350 chartsare used.

【Special Video vol.01/Blacksun】
https://www.gogojungle.co.jp/info/22955
【Special Video vol.02/Blacksun】
https://www.gogojungle.co.jp/info/22956
【Special Video vol.03/Blacksun】
https://www.gogojungle.co.jp/info/22957
==============================
The MT5 Beta Version has been released!!
mBDSR (Product ID 11836) Purchase Bonus】MT5 Indicator (Beta) “mBDSR (No filter, RCI filter, MA filter)”
https://www.gogojungle.co.jp/tools/indicators/56765
【Master RCI!! Trend reversal, dip buying, pullback selling】
An indicator with strong synergy when combined with RCI【BODSOR・mBDSR】
and methods・case studies (PDF) ★GogoJungle AWARD2020 Winner★
https://www.gogojungle.co.jp/tools/indicators/11836
MT5 offers20-minute chart as the standard.
AUDJPY 20-minute chart
Looking at the 3-minute chart above,a counter-trend lineis broken to the upside, and thena double bottomis formed, and on the subsequent declinethe mBDSR (RCI two-filter) dip-buy signallights up, and the price rises firmly.
From this example,the trading approach focusing on counter-trend lines and double bottomsandthe signals of mBDSRshow a high degree of compatibility.
※For readability, some charts in this article may have circles, lines, or boxes added.
Indicators with strong synergy when combined with RCI【BODSOR・mBDSR】
and methods・case studies (PDF) ★GogoJungle AWARD2020 Winner★
https://www.gogojungle.co.jp/tools/indicators/11836
The PDF file includes 358 files (over 1,400 pages, over 470,000 words).
Many of these are summarizing how to logically link higher and lower timeframes using three RCI lines to progressively analyze multiple lower timeframes, ultimately waiting for pullbacks or pullback buys on the lower timeframes (the mBDSR signals).
Additionally,many focus on identifying points where multiple entry rationales overlap.There are also many sections that explore using three RCI lines to identify targets for both upward and downward movement.
In the PDF explanations,
over 1,350 chartsare used.
× ![]()


