

From last Friday's USD/JPY chart: a rise ahead of U.S. employment data, a pullback buy signal in mBDSR (RCI2 bands filter)
============
【Special Video vol.01/Blacksun】
https://www.gogojungle.co.jp/info/22955
【Special Video vol.02/Blacksun】
https://www.gogojungle.co.jp/info/22956
【Special Video vol.03/Blacksun】
https://www.gogojungle.co.jp/info/22957
============
【MT5 Version Beta】 has been released!!
mBDSR (Product ID 11836) Purchase Bonus】 MT5 Indicator (Beta) “mBDSR (without filters, RCI filter, MA filter)”
https://www.gogojungle.co.jp/tools/indicators/56765
【Master RCI!! Trend Reversal, Buy on Dips, Sell on Rallies】
An indicator that shines when used in combination with RCI【BODSOR・mBDSR】
and methodology/case studies (PDF) ★GogoJungle AWARD2020 Winner★
https://www.gogojungle.co.jp/tools/indicators/11836
MT5 includes12-minute chart and20-minute chart as standard options.
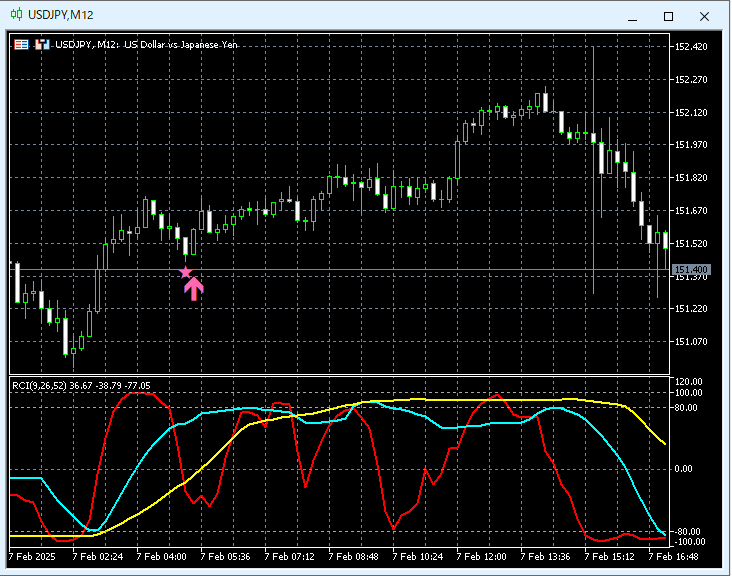
USDJPY 12-minute chart
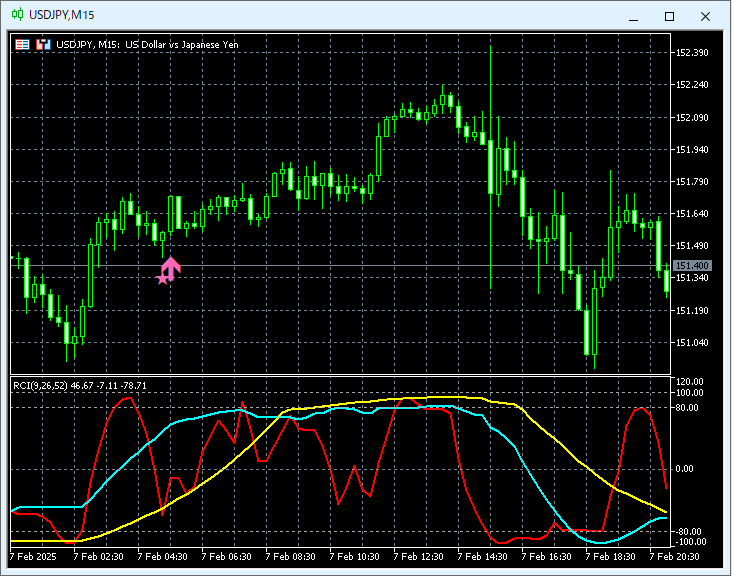
USDJPY 15-minute chart
USDJPY 20-minute chart
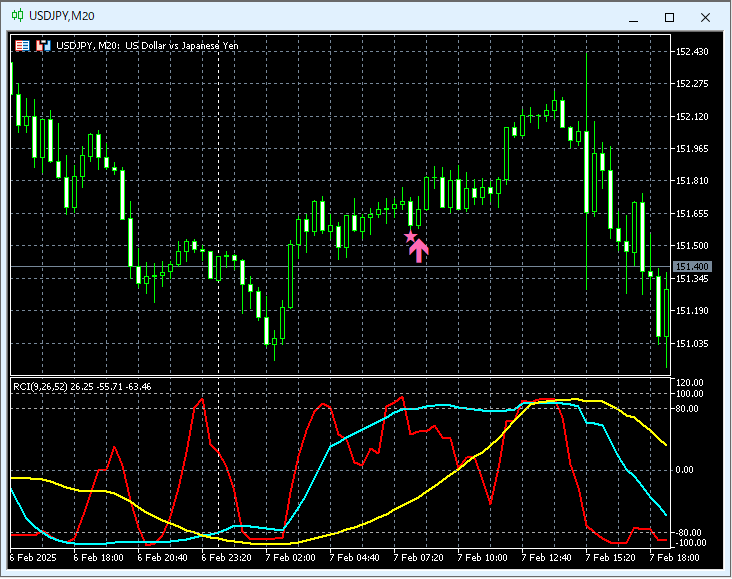
U.S. Employment StatisticsSignal for a dip buy withmBDSR (2 RCI filters) during the rise before release. Signals light up in order 12-min → 15-min → 20-min and rise.
An indicator that shines when used in combination with RCI【BODSOR・mBDSR】
and methodology/case studies (PDF) ★GogoJungle AWARD2020 Winner★
https://www.gogojungle.co.jp/tools/indicators/11836
The PDF file includes 358 files (over 1,400 pages, over 470,000 characters in total).
Many of these areexamples that break down the timing for dips buying or rallies on lower timeframes by logically linking higher and lower timeframes using three RCI lines..
Also,many entries focus on identifying points where multiple entry signals overlap.
Additionally,it includes methods for exploring upward or downward targets using three RCI lines.
In the PDF explanations,there are over 1,350 charts used.


