

[RCI Strategy] Break of Support and Fibonacci and mBDSR Rebound Sell Signal
==============================
【Special Video vol.01/Blacksun】
https://www.gogojungle.co.jp/info/22955
【Special Video vol.02/Blacksun】
https://www.gogojungle.co.jp/info/22956
【Special Video vol.03/Blacksun】
https://www.gogojungle.co.jp/info/22957
==============================
【MT5 Version Beta】 has been released!!
mBDSR (Product ID 11836) Purchase Bonus】MT5 Indicator (Beta) “mBDSR (No filter, RCI filter, MA filter)”
https://www.gogojungle.co.jp/tools/indicators/56765
【Master RCI!! Trend Reversal, Buy on Dips, Sell on Rallies】
An indicator that shines in combination with RCI【BODSOR・mBDSR】
and techniques/case studies (PDF) ★GogoJungle AWARD2020 Winner★
https://www.gogojungle.co.jp/tools/indicators/11836
GBP/USD Pounds Ocean? GBP/AUD 8-hour chart
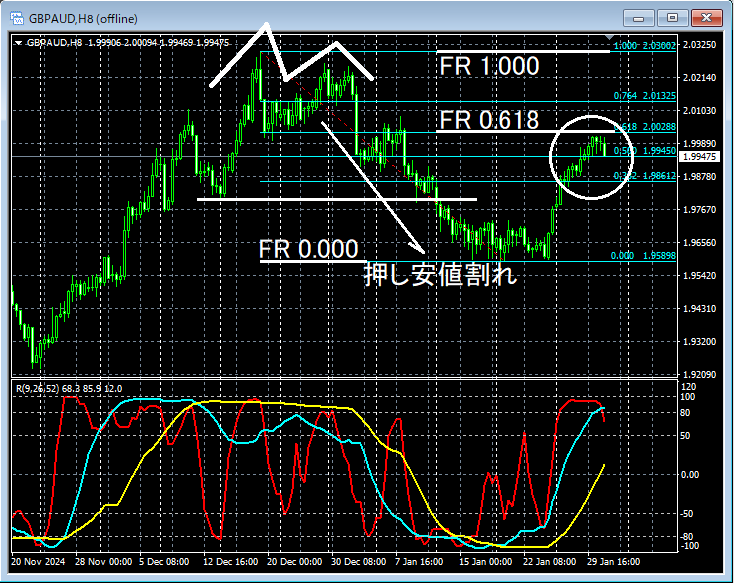
Focus on the area encircled by a white circle on the 8-hour chart above.Double Topfrom its dropbreaks the swing low. After that,Fibonacci retracement 61.8%rises to near that level, suggesting to look for signs of downtrend on lower timeframes...
GBP/AUD 1-hour chart
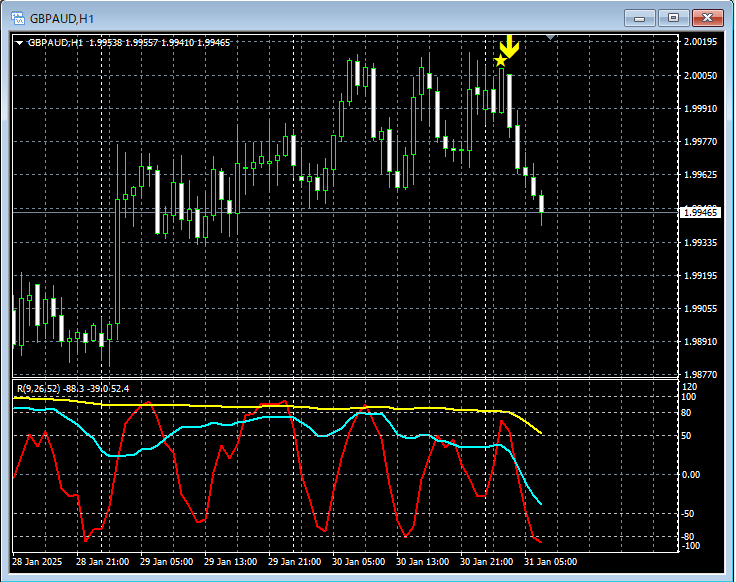
On the above 1-hour chart,mBDSR (2 RCI filters)sell-off signals light up, and subsequently price continues to decline smoothly.
From this example,a trading method focused on Dow Theory and Fibonacci retracementandthe signals of mBDSRshow a high degree of compatibility.
Additionally, in this example, placing the stop-loss slightly above the most recent highcan yield a high risk-reward trade.
※Please note that in charts introduced in this article, for clarity, circles, lines, and rectangles may be drawn.
An indicator that shines in combination with RCI【BODSOR・mBDSR】
and techniques/case studies (PDF) ★GogoJungle AWARD2020 Winner★
https://www.gogojungle.co.jp/tools/indicators/11836
The PDF file includes 358 items (over 1,400 pages, over 470,000 characters in total).
Most of them describe the process of logically linking higher and lower timeframes using three RCI lines, examining multiple lower-timeframe conditions sequentially, and ultimately waiting for the signal to buy on dips or sell on rallies on the lower timeframes (i.e., mBDSR signals).
Additionally,there are many that focus on identifying points where multiple entry reasons overlap.Many also include methods to explore upward or downward targets using three RCI lines.
In the PDF explanations,more than 1,350 chartsare used.

【Special Video vol.01/Blacksun】
https://www.gogojungle.co.jp/info/22955
【Special Video vol.02/Blacksun】
https://www.gogojungle.co.jp/info/22956
【Special Video vol.03/Blacksun】
https://www.gogojungle.co.jp/info/22957
==============================
【MT5 Version Beta】 has been released!!
mBDSR (Product ID 11836) Purchase Bonus】MT5 Indicator (Beta) “mBDSR (No filter, RCI filter, MA filter)”
https://www.gogojungle.co.jp/tools/indicators/56765
【Master RCI!! Trend Reversal, Buy on Dips, Sell on Rallies】
An indicator that shines in combination with RCI【BODSOR・mBDSR】
and techniques/case studies (PDF) ★GogoJungle AWARD2020 Winner★
https://www.gogojungle.co.jp/tools/indicators/11836
GBP/USD Pounds Ocean? GBP/AUD 8-hour chart
Focus on the area encircled by a white circle on the 8-hour chart above.Double Topfrom its dropbreaks the swing low. After that,Fibonacci retracement 61.8%rises to near that level, suggesting to look for signs of downtrend on lower timeframes...
GBP/AUD 1-hour chart
On the above 1-hour chart,mBDSR (2 RCI filters)sell-off signals light up, and subsequently price continues to decline smoothly.
From this example,a trading method focused on Dow Theory and Fibonacci retracementandthe signals of mBDSRshow a high degree of compatibility.
Additionally, in this example, placing the stop-loss slightly above the most recent highcan yield a high risk-reward trade.
※Please note that in charts introduced in this article, for clarity, circles, lines, and rectangles may be drawn.
An indicator that shines in combination with RCI【BODSOR・mBDSR】
and techniques/case studies (PDF) ★GogoJungle AWARD2020 Winner★
https://www.gogojungle.co.jp/tools/indicators/11836
The PDF file includes 358 items (over 1,400 pages, over 470,000 characters in total).
Most of them describe the process of logically linking higher and lower timeframes using three RCI lines, examining multiple lower-timeframe conditions sequentially, and ultimately waiting for the signal to buy on dips or sell on rallies on the lower timeframes (i.e., mBDSR signals).
Additionally,there are many that focus on identifying points where multiple entry reasons overlap.Many also include methods to explore upward or downward targets using three RCI lines.
In the PDF explanations,more than 1,350 chartsare used.
× ![]()


