

Yesterday 2025/01/31 USD/JPY RCI three-line setup and pullback high, and mBDSR oversold buy signal
==============================
【Special Footage vol.01/Blacksun】
https://www.gogojungle.co.jp/info/22955
【Special Footage vol.02/Blacksun】
https://www.gogojungle.co.jp/info/22956
【Special Footage vol.03/Blacksun】
https://www.gogojungle.co.jp/info/22957
==============================
【MT5 Version Beta】 has been released!!
mBDSR (Product ID 11836) Purchase Bonus】MT5 Version Indicator (Beta) “mBDSR (No filter, RCI filter, MA filter)”
https://www.gogojungle.co.jp/tools/indicators/56765
【Mastering RCI!! Trend Reversal, Buy on Dips, Sell on Rallies】
An indicator that shines when used in combination with RCI【BODSOR・mBDSR】
and methods/case studies (PDF) ★GogoJungle AWARD2020 Winner★
https://www.gogojungle.co.jp/tools/indicators/11836
MT5 has6-minute chart is provided as standard.
USDJPY – Dollar/Yen 1-hour chart
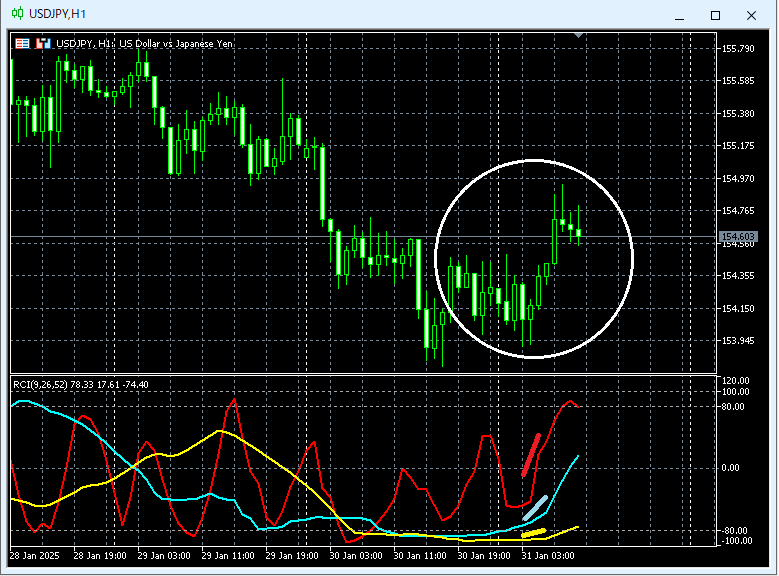
If you look at the area circled in white on the 1-hour chart above,Three RCI lines are aligned and trending upward, showing a very strong pattern. It may also be a good scene to aim for a dip-buy on a lower time frame. Let’s examine the lower time frame in more detail.
USDJPY – Dollar/Yen 6-minute chart
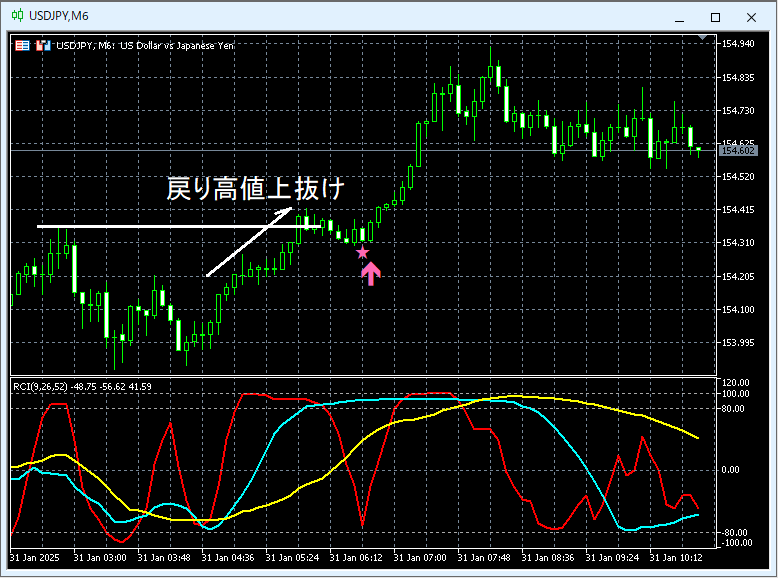
Looking at the 6-minute chart above,Pullback high is surpassed and on the subsequent dropmBDSR (RCI 2-filter) dip-buy signal lights up, and price has since risen steadily.
From this example,a trading method focusing on RCI three-line convergence and pullback highs (Dow Theory) andthe signals of mBDSR show high compatibility.
※Please note that in the charts referenced in this article, for explanation convenience, circles, lines, and rectangles may be drawn.
Indicators that shine in combination with RCI【BODSOR・mBDSR】
and method/case studies (PDF) ★GogoJungle AWARD2020 Winner★
https://www.gogojungle.co.jp/tools/indicators/11836
The PDF file includes 358 files (over 1,400 pages, over 470,000 characters in total).
Most of them arecompiled examples that explain a method of logically linking higher and lower time frames by using three-line RCI, and then waiting for pullbacks or rallies on the lower time frame (i.e., mBDSR signals)..
Additionally,many focus on identifying points where multiple entry reasons overlap..
Furthermore,the method to explore upside or downside targets using three-line RCI is also included..
In the PDF descriptions,more than 1,350 charts are used.

【Special Footage vol.01/Blacksun】
https://www.gogojungle.co.jp/info/22955
【Special Footage vol.02/Blacksun】
https://www.gogojungle.co.jp/info/22956
【Special Footage vol.03/Blacksun】
https://www.gogojungle.co.jp/info/22957
==============================
【MT5 Version Beta】 has been released!!
mBDSR (Product ID 11836) Purchase Bonus】MT5 Version Indicator (Beta) “mBDSR (No filter, RCI filter, MA filter)”
https://www.gogojungle.co.jp/tools/indicators/56765
【Mastering RCI!! Trend Reversal, Buy on Dips, Sell on Rallies】
An indicator that shines when used in combination with RCI【BODSOR・mBDSR】
and methods/case studies (PDF) ★GogoJungle AWARD2020 Winner★
https://www.gogojungle.co.jp/tools/indicators/11836
MT5 has6-minute chart is provided as standard.
USDJPY – Dollar/Yen 1-hour chart
If you look at the area circled in white on the 1-hour chart above,Three RCI lines are aligned and trending upward, showing a very strong pattern. It may also be a good scene to aim for a dip-buy on a lower time frame. Let’s examine the lower time frame in more detail.
USDJPY – Dollar/Yen 6-minute chart
Looking at the 6-minute chart above,Pullback high is surpassed and on the subsequent dropmBDSR (RCI 2-filter) dip-buy signal lights up, and price has since risen steadily.
From this example,a trading method focusing on RCI three-line convergence and pullback highs (Dow Theory) andthe signals of mBDSR show high compatibility.
※Please note that in the charts referenced in this article, for explanation convenience, circles, lines, and rectangles may be drawn.
Indicators that shine in combination with RCI【BODSOR・mBDSR】
and method/case studies (PDF) ★GogoJungle AWARD2020 Winner★
https://www.gogojungle.co.jp/tools/indicators/11836
The PDF file includes 358 files (over 1,400 pages, over 470,000 characters in total).
Most of them arecompiled examples that explain a method of logically linking higher and lower time frames by using three-line RCI, and then waiting for pullbacks or rallies on the lower time frame (i.e., mBDSR signals)..
Additionally,many focus on identifying points where multiple entry reasons overlap..
Furthermore,the method to explore upside or downside targets using three-line RCI is also included..
In the PDF descriptions,more than 1,350 charts are used.
× ![]()


