

Master RCI!! Return high price and the mBDSR (RCI two-filter) sell signal on pullback
0
【Mastering RCI!! Trend Reversal, Buy on Dips, and Sell on Rallies】
Indicator 【BODSOR・mBDSR】 that shines in combination with RCI
Methods and Case Studies (PDF) ★GogoJungle AWARD 2020 winner★
https://www.gogojungle.co.jp/tools/indicators/11836
AUDUSD 5-minute chart
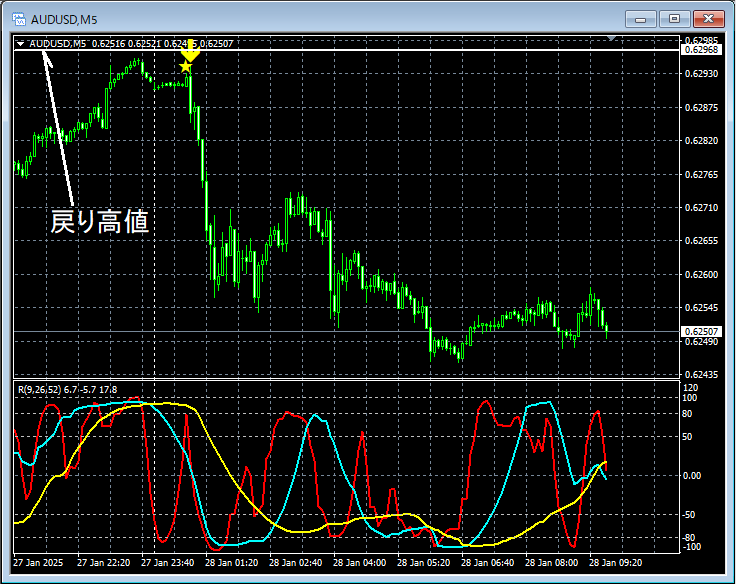
pullback highis showing a tendency to reverse around.mBDSR (RCI two-line filter) sell-on-rebound signalis lit, indicating that price is steadily moving lower.
From this example,a trading method focused on the pullback high (Dow Theory)andthe signals of mBDSRshow a strong compatibility.
※Please note that in the charts introduced in this article, for convenience of explanation, circles, lines, and rectangles may have been added.
Indicator 【BODSOR・mBDSR】 that shines in combination with RCI
Methods and Case Studies (PDF) ★GogoJungle AWARD 2020 winner★
https://www.gogojungle.co.jp/tools/indicators/11836
The PDF file includes 358 items (over 1,400 pages, over 470,000 characters in total).
Many of themwhereby using the three-line RCI to logically link higher and lower timeframes, analyzing multiple lower-timeframe conditions step by step, and ultimately waiting for pullback buys or sell-on-rebound timings (i.e., mBDSR signals) on the lower timeframesis condensed into examples.
Furthermore,there are many that emphasize identifying points where multiple entry reasons coincide..
Also included is a method to explore price targets for rallies and declines using the three-line RCI.
In the PDF descriptions,over 1,350 chartsare used.

Indicator 【BODSOR・mBDSR】 that shines in combination with RCI
Methods and Case Studies (PDF) ★GogoJungle AWARD 2020 winner★
https://www.gogojungle.co.jp/tools/indicators/11836
AUDUSD 5-minute chart
pullback highis showing a tendency to reverse around.mBDSR (RCI two-line filter) sell-on-rebound signalis lit, indicating that price is steadily moving lower.
From this example,a trading method focused on the pullback high (Dow Theory)andthe signals of mBDSRshow a strong compatibility.
※Please note that in the charts introduced in this article, for convenience of explanation, circles, lines, and rectangles may have been added.
Indicator 【BODSOR・mBDSR】 that shines in combination with RCI
Methods and Case Studies (PDF) ★GogoJungle AWARD 2020 winner★
https://www.gogojungle.co.jp/tools/indicators/11836
The PDF file includes 358 items (over 1,400 pages, over 470,000 characters in total).
Many of themwhereby using the three-line RCI to logically link higher and lower timeframes, analyzing multiple lower-timeframe conditions step by step, and ultimately waiting for pullback buys or sell-on-rebound timings (i.e., mBDSR signals) on the lower timeframesis condensed into examples.
Furthermore,there are many that emphasize identifying points where multiple entry reasons coincide..
Also included is a method to explore price targets for rallies and declines using the three-line RCI.
In the PDF descriptions,over 1,350 chartsare used.
× ![]()


