

[MT5 Version] Counter Trend Line and mBDSR (RCI two-filter) Buy Signal
0
============================
【Special Video vol.01/Blacksun】
https://www.gogojungle.co.jp/info/22955
【Special Video vol.02/Blacksun】
https://www.gogojungle.co.jp/info/22956
【Special Video vol.03/Blacksun】
https://www.gogojungle.co.jp/info/22957
============================
The MT5 Beta version has been released!!
mBDSR (Product ID 11836) Purchase Bonus】MT5 Indicator (Beta) "mBDSR (no filter, RCI filter, MA filter)"
https://www.gogojungle.co.jp/tools/indicators/56765
【Master RCI!! Trend reversal, pullbacks, and selling the retrace】
An indicator that shines when used in combination with RCI【BODSOR・mBDSR】
and methods & case studies (PDF) ★GogoJungle AWARD2020 Winner★
https://www.gogojungle.co.jp/tools/indicators/11836
MT5 already has3-minute chartas the standard option.
EURJPY 3-minute chart
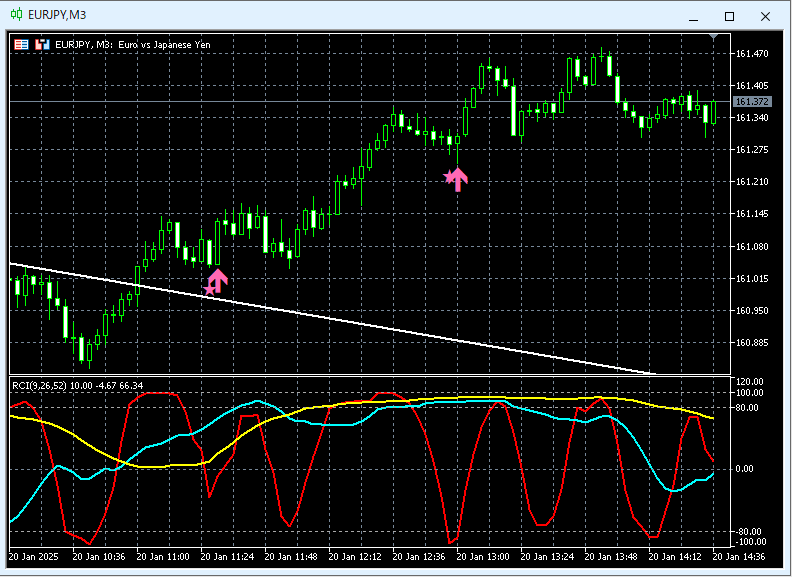
If you look at the 3-minute chart above,you can see a buy signal on a pullback with mBDSR (RCI two-filter) after breaking above the counter-trend line, and the price rises firmly.In this case, the buy signal on the pullback lights up again, and the price rises further.
From this example,it is evident that a trading method focused on the counter-trend lineand thesignals of mBDSRare highly compatible.
※Please note that in the charts shown in this article, for convenience of explanation, circles, lines, and rectangles may have been drawn.
An indicator that shines when used in combination with RCI【BODSOR・mBDSR】
and methods & case studies (PDF) ★GogoJungle AWARD2020 Winner★
https://www.gogojungle.co.jp/tools/indicators/11836
The PDF file includes 358 items (over 1,400 pages, over 470,000 characters).
Many of them areexamples that break down the process of logically linking the higher and lower time frames using three RCI lines, then waiting for pullbacks or retracements (i.e., mBDSR signals) on the lower time frame..
Additionally,there are many pieces that emphasize identifying points where multiple entry reasons overlap..
Also included is a method to explore upward and downward targets using Three-RCI lines.
In the explanations within the PDF file,more than 1,350 charts are used.

【Special Video vol.01/Blacksun】
https://www.gogojungle.co.jp/info/22955
【Special Video vol.02/Blacksun】
https://www.gogojungle.co.jp/info/22956
【Special Video vol.03/Blacksun】
https://www.gogojungle.co.jp/info/22957
============================
The MT5 Beta version has been released!!
mBDSR (Product ID 11836) Purchase Bonus】MT5 Indicator (Beta) "mBDSR (no filter, RCI filter, MA filter)"
https://www.gogojungle.co.jp/tools/indicators/56765
【Master RCI!! Trend reversal, pullbacks, and selling the retrace】
An indicator that shines when used in combination with RCI【BODSOR・mBDSR】
and methods & case studies (PDF) ★GogoJungle AWARD2020 Winner★
https://www.gogojungle.co.jp/tools/indicators/11836
MT5 already has3-minute chartas the standard option.
EURJPY 3-minute chart
If you look at the 3-minute chart above,you can see a buy signal on a pullback with mBDSR (RCI two-filter) after breaking above the counter-trend line, and the price rises firmly.In this case, the buy signal on the pullback lights up again, and the price rises further.
From this example,it is evident that a trading method focused on the counter-trend lineand thesignals of mBDSRare highly compatible.
※Please note that in the charts shown in this article, for convenience of explanation, circles, lines, and rectangles may have been drawn.
An indicator that shines when used in combination with RCI【BODSOR・mBDSR】
and methods & case studies (PDF) ★GogoJungle AWARD2020 Winner★
https://www.gogojungle.co.jp/tools/indicators/11836
The PDF file includes 358 items (over 1,400 pages, over 470,000 characters).
Many of them areexamples that break down the process of logically linking the higher and lower time frames using three RCI lines, then waiting for pullbacks or retracements (i.e., mBDSR signals) on the lower time frame..
Additionally,there are many pieces that emphasize identifying points where multiple entry reasons overlap..
Also included is a method to explore upward and downward targets using Three-RCI lines.
In the explanations within the PDF file,more than 1,350 charts are used.
× ![]()


