

Mastering MT5版 RCI!! Dollar/Yen Break below support and mBDSR pullback sell signal
0
============
【Special Video vol.01/Blacksun】
https://www.gogojungle.co.jp/info/22955
【Special Video vol.02/Blacksun】
https://www.gogojungle.co.jp/info/22956
【Special Video vol.03/Blacksun】
https://www.gogojungle.co.jp/info/22957
============
The MT5 version Beta has been released!!
mBDSR (Product ID 11836) Purchase Bonus】 MT5 Indicator (Beta) “mBDSR (No filter, RCI filter, MA filter)”
https://www.gogojungle.co.jp/tools/indicators/56765
【Master RCI!! Trend Reversal, Buy the Dips, Sell on Rallies】
Indicators that pair powerfully with RCI【BODSOR・mBDSR】
and Methodology / Case Studies (PDF) ★GogoJungle AWARD 2020 Winner★
https://www.gogojungle.co.jp/tools/indicators/11836
MT5includes10-minute chartas the standard.
USD/JPY 10-minute chart
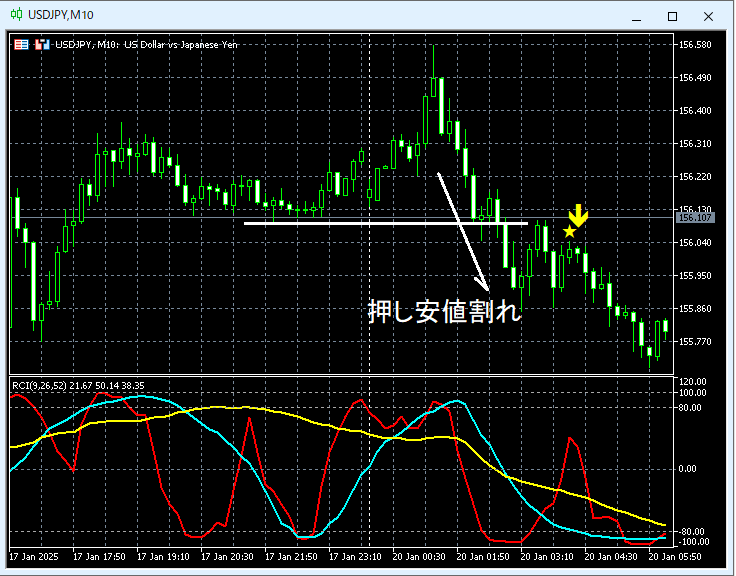
On the above 10-minute chart,the dip-low breakoccurs,the mBDSR (2 RCI filter) sell signallights up and price moves lower.
From this example,a Dow Theory–focused trading approachandthe signal of mBDSRappear to be highly compatible.
※Please note that in the charts introduced in this article, for convenience of explanation, circles, lines, and rectangles may have been added.
Indicators that pair powerfully with RCI【BODSOR・mBDSR】
and Methodology / Case Studies (PDF) ★GogoJungle AWARD2020 Winner★
https://www.gogojungle.co.jp/tools/indicators/11836
The PDF file includes 358 items (over 1,400 pages, over 470,000 words).
Many of these areexamples that lay out how to logically link higher and lower timeframes using three RCI lines to examine multiple lower timeframes progressively, ultimately waiting for a dip-buy or pullback sell timing (the mBDSR signal) on the lower timeframe.
Additionally,there are many that focus on identifying points where multiple entry signals align..
Furthermore,it also includes a method for exploring upward and downward targets using three RCI lines..
In the PDF explanations,more than 1,350 chartsare used.

【Special Video vol.01/Blacksun】
https://www.gogojungle.co.jp/info/22955
【Special Video vol.02/Blacksun】
https://www.gogojungle.co.jp/info/22956
【Special Video vol.03/Blacksun】
https://www.gogojungle.co.jp/info/22957
============
The MT5 version Beta has been released!!
mBDSR (Product ID 11836) Purchase Bonus】 MT5 Indicator (Beta) “mBDSR (No filter, RCI filter, MA filter)”
https://www.gogojungle.co.jp/tools/indicators/56765
【Master RCI!! Trend Reversal, Buy the Dips, Sell on Rallies】
Indicators that pair powerfully with RCI【BODSOR・mBDSR】
and Methodology / Case Studies (PDF) ★GogoJungle AWARD 2020 Winner★
https://www.gogojungle.co.jp/tools/indicators/11836
MT5includes10-minute chartas the standard.
USD/JPY 10-minute chart
On the above 10-minute chart,the dip-low breakoccurs,the mBDSR (2 RCI filter) sell signallights up and price moves lower.
From this example,a Dow Theory–focused trading approachandthe signal of mBDSRappear to be highly compatible.
※Please note that in the charts introduced in this article, for convenience of explanation, circles, lines, and rectangles may have been added.
Indicators that pair powerfully with RCI【BODSOR・mBDSR】
and Methodology / Case Studies (PDF) ★GogoJungle AWARD2020 Winner★
https://www.gogojungle.co.jp/tools/indicators/11836
The PDF file includes 358 items (over 1,400 pages, over 470,000 words).
Many of these areexamples that lay out how to logically link higher and lower timeframes using three RCI lines to examine multiple lower timeframes progressively, ultimately waiting for a dip-buy or pullback sell timing (the mBDSR signal) on the lower timeframe.
Additionally,there are many that focus on identifying points where multiple entry signals align..
Furthermore,it also includes a method for exploring upward and downward targets using three RCI lines..
In the PDF explanations,more than 1,350 chartsare used.
× ![]()


