

[MT5 Version] Pullback low and mBDSR (RCI2 filter) buy signal on higher timeframe Gold XAUUSD
0
==============================
【Special Video vol.01/Blacksun】
https://www.gogojungle.co.jp/info/22955
【Special Video vol.02/Blacksun】
https://www.gogojungle.co.jp/info/22956
【Special Video vol.03/Blacksun】
https://www.gogojungle.co.jp/info/22957
==============================
The MT5 version Beta has been released!!
mBDSR (Product ID 11836) Purchase Bonus】 MT5 Indicator (Beta) “mBDSR (no filter, RCI filter, MA filter)”
https://www.gogojungle.co.jp/tools/indicators/56765
【Master RCI!! Trend reversal, pullback buying, and selling on retracements】
An indicator that shines when combined with RCI【BODSOR・mBDSR】
and its methods and case studies (PDF) ★GogoJungle AWARD2020 winner★
https://www.gogojungle.co.jp/tools/indicators/11836
MT5 version3-minute chart is provided as standard.
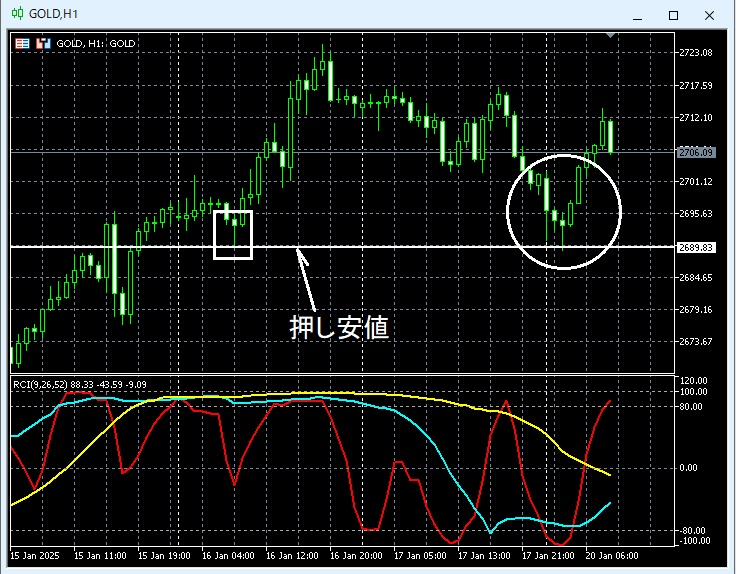
Gold XAUUSD 1-hour chart
Gold XAUUSD 3-minute chart
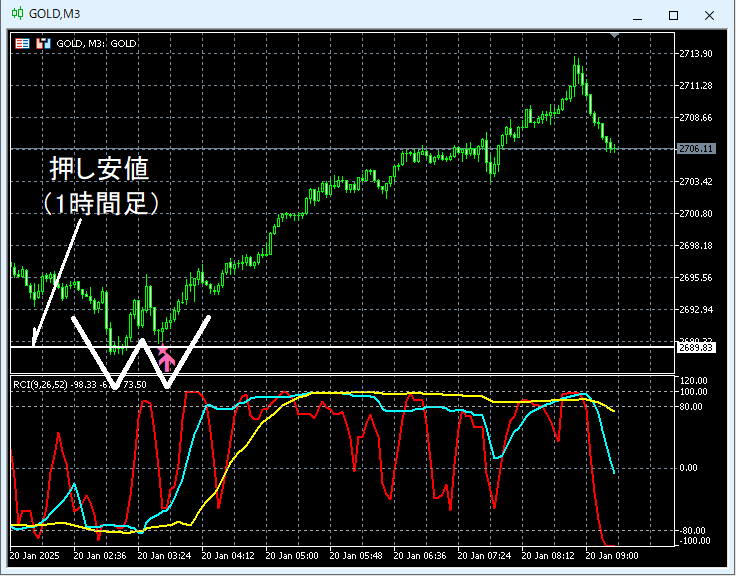
We will look at the area circled with a white circle on the 1-hour chart on the 3-minute chart above.Pullback low (1-hour level) near this areaDouble bottom forms and rises.Double bottom The timing of the rise on the right-side troughmBDSR (Two RCI filter) pullback buy signal is well captured.
From this example, there is a strong synergy between trading methods that focus on Dow Theory and double bottoms and the signals of mBDSR.
※ Please note that in the charts shown in this article, circles, lines, and squares may be added for explanatory convenience.
The indicator that shines when combined with RCI【BODSOR・mBDSR】
and its methods and case studies (PDF) ★GogoJungle AWARD2020 winner★
https://www.gogojungle.co.jp/tools/indicators/11836
The PDF file contains 358 items (over 1,400 pages, over 470,000 words in total).
Many of them are examples that have been worked out by logically linking higher and lower timeframes using three RCI lines to examine multiple lower timeframes sequentially, ultimately waiting for pullback buying or retracement selling timing (the signals of mBDSR) on the lower timeframes.
In addition, many focus on identifying points where multiple entry criteria converge.
Additionally, it also includes methods to explore upside and downside targets using the three-RCI-line approach..
In the PDF explanations, more than 1,350 charts are used.

【Special Video vol.01/Blacksun】
https://www.gogojungle.co.jp/info/22955
【Special Video vol.02/Blacksun】
https://www.gogojungle.co.jp/info/22956
【Special Video vol.03/Blacksun】
https://www.gogojungle.co.jp/info/22957
==============================
The MT5 version Beta has been released!!
mBDSR (Product ID 11836) Purchase Bonus】 MT5 Indicator (Beta) “mBDSR (no filter, RCI filter, MA filter)”
https://www.gogojungle.co.jp/tools/indicators/56765
【Master RCI!! Trend reversal, pullback buying, and selling on retracements】
An indicator that shines when combined with RCI【BODSOR・mBDSR】
and its methods and case studies (PDF) ★GogoJungle AWARD2020 winner★
https://www.gogojungle.co.jp/tools/indicators/11836
MT5 version3-minute chart is provided as standard.
Gold XAUUSD 1-hour chart
Gold XAUUSD 3-minute chart
We will look at the area circled with a white circle on the 1-hour chart on the 3-minute chart above.Pullback low (1-hour level) near this areaDouble bottom forms and rises.Double bottom The timing of the rise on the right-side troughmBDSR (Two RCI filter) pullback buy signal is well captured.
From this example, there is a strong synergy between trading methods that focus on Dow Theory and double bottoms and the signals of mBDSR.
※ Please note that in the charts shown in this article, circles, lines, and squares may be added for explanatory convenience.
The indicator that shines when combined with RCI【BODSOR・mBDSR】
and its methods and case studies (PDF) ★GogoJungle AWARD2020 winner★
https://www.gogojungle.co.jp/tools/indicators/11836
The PDF file contains 358 items (over 1,400 pages, over 470,000 words in total).
Many of them are examples that have been worked out by logically linking higher and lower timeframes using three RCI lines to examine multiple lower timeframes sequentially, ultimately waiting for pullback buying or retracement selling timing (the signals of mBDSR) on the lower timeframes.
In addition, many focus on identifying points where multiple entry criteria converge.
Additionally, it also includes methods to explore upside and downside targets using the three-RCI-line approach..
In the PDF explanations, more than 1,350 charts are used.
× ![]()


