

[MT5 Version] Buy signal on pullback when the previous low of the higher timeframe and mBDSR (RCI connection with 2 lines) for bowing bullish signal Oji Kana
====================
【Special Video vol.01/Blacksun】
https://www.gogojungle.co.jp/info/22955
【Special Video vol.02/Blacksun】
https://www.gogojungle.co.jp/info/22956
【Special Video vol.03/Blacksun】
https://www.gogojungle.co.jp/info/22957
====================
【MT5 Version Beta】 has been released!!
mBDSR (Product ID 11836) Purchase Bonus】 MT5 Version Indicator (Beta) “mBDSR (No filter, RCI filter, MA filter)”
https://www.gogojungle.co.jp/tools/indicators/56765
【Master RCI!! Trend Reversal, Buy on Dip, Sell on Rally】
An indicator that shines when combined with RCI【BODSOR・mBDSR】
and methods/case studies (PDF) ★GogoJungle AWARD2020 Winner★
https://www.gogojungle.co.jp/tools/indicators/11836
MT5 offers3-hour chart as the default.
AUD/USD CAD
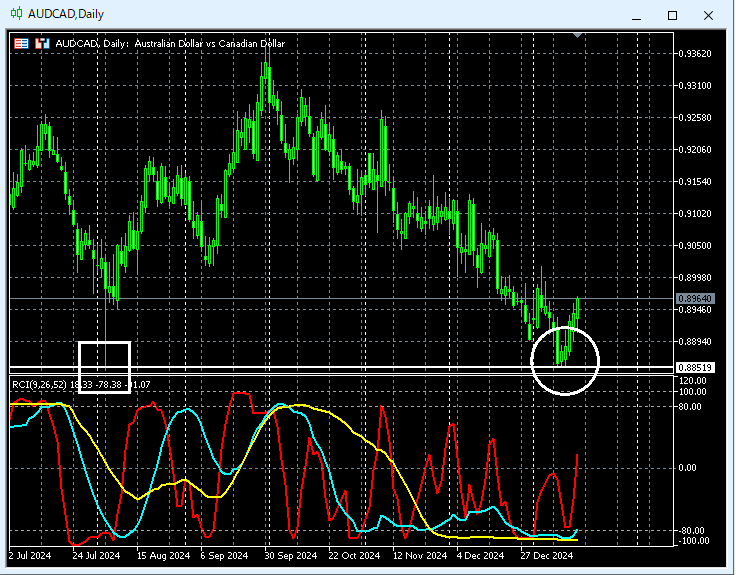
AUD/USD CAD 3-hour chart
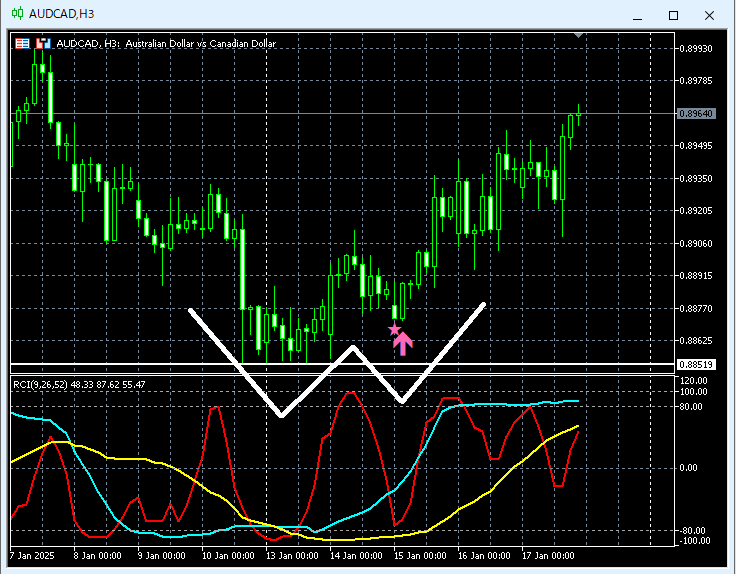
We will look at the area circled in white on the daily chart on the 3-hour chart above.Previous low (daily level) nearbyDouble Bottom forms and rises.Double Bottom The timing of the upward start at the right-side trough of the double bottommBDSR (2-filter RCI) Buy-the-dip signal captures this well.
From this example,a trading method focused on the previous low and double bottom andmBDSR signals show a strong compatibility.
※ Please note that some charts mentioned in this article may have added circles, lines, or boxes for explanatory ease.
An indicator that shines when combined with RCI【BODSOR・mBDSR】
and methods/case studies (PDF) ★GogoJungle AWARD2020 Winner★
https://www.gogojungle.co.jp/tools/indicators/11836
The PDF file includes 358 pieces (over 1,400 pages, over 470,000 characters in total).
Most of them aresummaries of how to logically link higher and lower timeframes using the 3-line RCI, then gradually analyzing multiple lower timeframes and ultimately waiting for a dip or rally timing (the mBDSR signal) on the lower timeframe.
Additionally,many focus on identifying points where multiple entry reasons align..
Note thatthe method using three RCI lines to explore upward and downward targets is also included..
In the PDF explanation,more than 1,350 charts are used.

【Special Video vol.01/Blacksun】
https://www.gogojungle.co.jp/info/22955
【Special Video vol.02/Blacksun】
https://www.gogojungle.co.jp/info/22956
【Special Video vol.03/Blacksun】
https://www.gogojungle.co.jp/info/22957
====================
【MT5 Version Beta】 has been released!!
mBDSR (Product ID 11836) Purchase Bonus】 MT5 Version Indicator (Beta) “mBDSR (No filter, RCI filter, MA filter)”
https://www.gogojungle.co.jp/tools/indicators/56765
【Master RCI!! Trend Reversal, Buy on Dip, Sell on Rally】
An indicator that shines when combined with RCI【BODSOR・mBDSR】
and methods/case studies (PDF) ★GogoJungle AWARD2020 Winner★
https://www.gogojungle.co.jp/tools/indicators/11836
MT5 offers3-hour chart as the default.
AUD/USD CAD
AUD/USD CAD 3-hour chart
We will look at the area circled in white on the daily chart on the 3-hour chart above.Previous low (daily level) nearbyDouble Bottom forms and rises.Double Bottom The timing of the upward start at the right-side trough of the double bottommBDSR (2-filter RCI) Buy-the-dip signal captures this well.
From this example,a trading method focused on the previous low and double bottom andmBDSR signals show a strong compatibility.
※ Please note that some charts mentioned in this article may have added circles, lines, or boxes for explanatory ease.
An indicator that shines when combined with RCI【BODSOR・mBDSR】
and methods/case studies (PDF) ★GogoJungle AWARD2020 Winner★
https://www.gogojungle.co.jp/tools/indicators/11836
The PDF file includes 358 pieces (over 1,400 pages, over 470,000 characters in total).
Most of them aresummaries of how to logically link higher and lower timeframes using the 3-line RCI, then gradually analyzing multiple lower timeframes and ultimately waiting for a dip or rally timing (the mBDSR signal) on the lower timeframe.
Additionally,many focus on identifying points where multiple entry reasons align..
Note thatthe method using three RCI lines to explore upward and downward targets is also included..
In the PDF explanation,more than 1,350 charts are used.
× ![]()


