

[Capture the Bottom and Reversal!!] Support zone, counter-trend line, double bottom, and mBDSR (RCI two-line filter) pullback buy signal
============
【Special Video vol.01/Blacksun】
https://www.gogojungle.co.jp/info/22955
【Special Video vol.02/Blacksun】
https://www.gogojungle.co.jp/info/22956
【Special Video vol.03/Blacksun】
https://www.gogojungle.co.jp/info/22957
============
【Master RCI!! Trend Reversal, Buy the Dip, Sell the Rally】
Indicator that shines when combined with RCI: 【BODSOR・mBDSR】
and Method/Case Study (PDF) ★GogoJungle AWARD2020 winner★
https://www.gogojungle.co.jp/tools/indicators/11836
New Zealand Dollar / US Dollar 5-minute chart
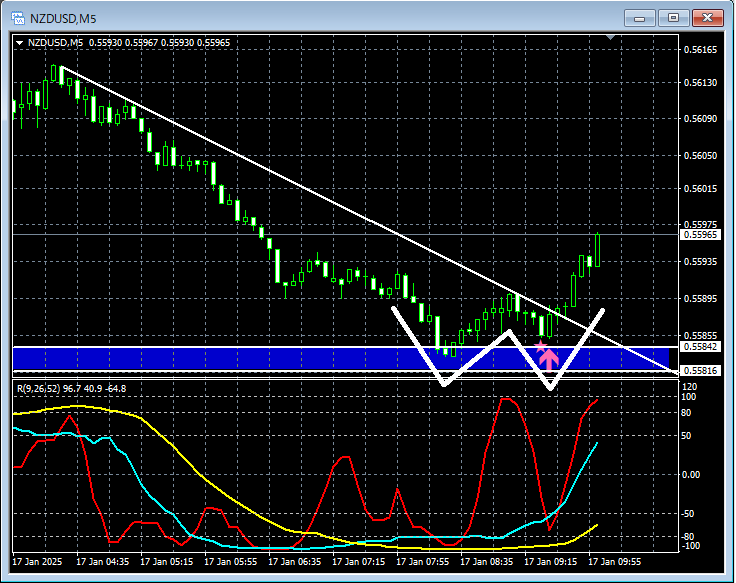
Looking at the 5-minute chart above,it fell to a support zoneand then bounced.It piercedthe counter-trend line.It formed a double bottomand rose. As a result,the timing of the rise on the right side of the double bottomis well captured by the buy-the-dip signal of mBDSR (RCI two-filter).
A double bottomandthe breakout above the counter-trend line (downward trend line)are sometimes viewed as chart patterns indicating a change from down to up, but from this example,it is evident that a trading method focusing on support zones, double bottoms, and counter-trend linesand thesignals of mBDSRhave a high degree of compatibility.
※Please note that in the charts shown in this article, for convenience of explanation, circles, straight lines, and rectangles may be added.
Indicator that shines when combined with RCI: 【BODSOR・mBDSR】
and Method/Case Study (PDF) ★GogoJungle AWARD2020 winner★
https://www.gogojungle.co.jp/tools/indicators/11836
The PDF file contains 358 items (over 1,400 pages, over 470,000 characters in total).
Most of them are summaries of examples that break down, using three-line RCI to logically link higher and lower timeframes, evaluate multiple lower-timeframe conditions sequentially, and ultimately wait for a buy-the-dip or sell-the-rally signal on the lower timeframe (the mBDSR signal).
Additionally,many of them focus on identifying points where multiple entry reasons coincide.There are also many sections that discuss methods for exploring upside and downside targets using three-line RCI.
In the explanation within the PDF file,
more than 1,350 chartsare used.

【Special Video vol.01/Blacksun】
https://www.gogojungle.co.jp/info/22955
【Special Video vol.02/Blacksun】
https://www.gogojungle.co.jp/info/22956
【Special Video vol.03/Blacksun】
https://www.gogojungle.co.jp/info/22957
============
【Master RCI!! Trend Reversal, Buy the Dip, Sell the Rally】
Indicator that shines when combined with RCI: 【BODSOR・mBDSR】
and Method/Case Study (PDF) ★GogoJungle AWARD2020 winner★
https://www.gogojungle.co.jp/tools/indicators/11836
New Zealand Dollar / US Dollar 5-minute chart
Looking at the 5-minute chart above,it fell to a support zoneand then bounced.It piercedthe counter-trend line.It formed a double bottomand rose. As a result,the timing of the rise on the right side of the double bottomis well captured by the buy-the-dip signal of mBDSR (RCI two-filter).
A double bottomandthe breakout above the counter-trend line (downward trend line)are sometimes viewed as chart patterns indicating a change from down to up, but from this example,it is evident that a trading method focusing on support zones, double bottoms, and counter-trend linesand thesignals of mBDSRhave a high degree of compatibility.
※Please note that in the charts shown in this article, for convenience of explanation, circles, straight lines, and rectangles may be added.
Indicator that shines when combined with RCI: 【BODSOR・mBDSR】
and Method/Case Study (PDF) ★GogoJungle AWARD2020 winner★
https://www.gogojungle.co.jp/tools/indicators/11836
The PDF file contains 358 items (over 1,400 pages, over 470,000 characters in total).
Most of them are summaries of examples that break down, using three-line RCI to logically link higher and lower timeframes, evaluate multiple lower-timeframe conditions sequentially, and ultimately wait for a buy-the-dip or sell-the-rally signal on the lower timeframe (the mBDSR signal).
Additionally,many of them focus on identifying points where multiple entry reasons coincide.There are also many sections that discuss methods for exploring upside and downside targets using three-line RCI.
In the explanation within the PDF file,
more than 1,350 chartsare used.
× ![]()


