

[MT5 Version] Counter-Trend Line and mBDSR (RCI two-filter) Sell Signal on Retracements AUDJPY
====================
【Special Video vol.01/Blacksun】
https://www.gogojungle.co.jp/info/22955
【Special Video vol.02/Blacksun】
https://www.gogojungle.co.jp/info/22956
【Special Video vol.03/Blacksun】
https://www.gogojungle.co.jp/info/22957
====================
【MT5 Version Beta】 has been released!!
mBDSR (Product ID 11836) Purchase Bonus】 MT5 Version Indicator (Beta) “mBDSR (No filter, RCI filter, MA filter)”
https://www.gogojungle.co.jp/tools/indicators/56765
【Master RCI!! Trend Reversal, Buy on Dips, Sell on Rallies】
An indicator that shines in combination with RCI【BODSOR・mBDSR】
and methods & case studies (PDF) ★GogoJungle AWARD2020 Winner★
https://www.gogojungle.co.jp/tools/indicators/11836
MT5 comes with4-minute chart as standard.
AUD/JPY 4-minute chart
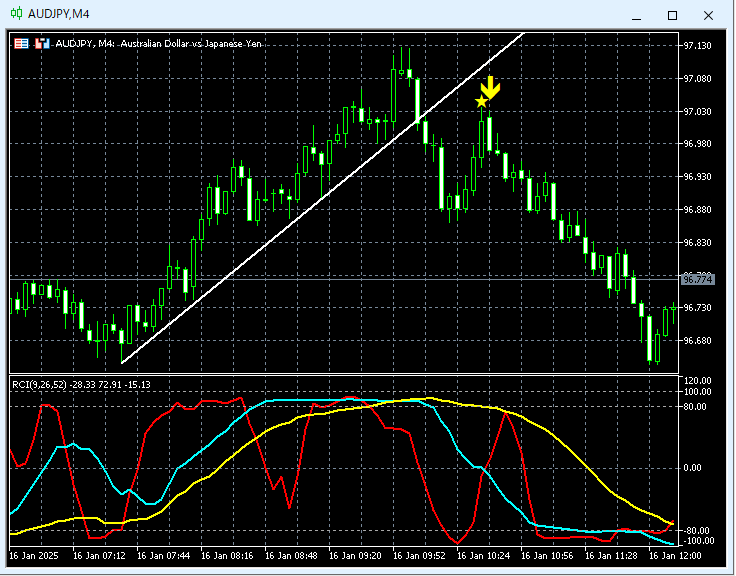
On the 4-minute chart above,Counter-trend line After breaking below, the rise mBDSR (2 RCI filters) Sell signal lights up and the price declines.
From this example, a trading approach focused on counter-trend lines and the harmony with mBDSR signals can be seen.
※ Please note that in charts introduced in this article, for convenience of explanation, circles, straight lines, and rectangles may have been drawn.
Indicators that shine in combination with RCI【BODSOR・mBDSR】
and methods & case studies (PDF) ★GogoJungle AWARD2020 Winner★
https://www.gogojungle.co.jp/tools/indicators/11836
The PDF file includes 358 files (over 1,400 pages, more than 470,000 characters in total).
Many of these areexamples that detail a method of logically linking higher and lower timeframes using 3 RCI lines, sequentially examining multiple lower-timeframe conditions, and ultimately waiting for a dip buy or pullback sell timing (the mBDSR signals) on the lower timeframe..
Additionally,there are many that emphasize pinpointing points where multiple entry reasons coincide..
Also included is a method for exploring upward and downward targets using the 3-RCI-line approach.
In the PDF explanations,there are over 1,350 charts used..

【Special Video vol.01/Blacksun】
https://www.gogojungle.co.jp/info/22955
【Special Video vol.02/Blacksun】
https://www.gogojungle.co.jp/info/22956
【Special Video vol.03/Blacksun】
https://www.gogojungle.co.jp/info/22957
====================
【MT5 Version Beta】 has been released!!
mBDSR (Product ID 11836) Purchase Bonus】 MT5 Version Indicator (Beta) “mBDSR (No filter, RCI filter, MA filter)”
https://www.gogojungle.co.jp/tools/indicators/56765
【Master RCI!! Trend Reversal, Buy on Dips, Sell on Rallies】
An indicator that shines in combination with RCI【BODSOR・mBDSR】
and methods & case studies (PDF) ★GogoJungle AWARD2020 Winner★
https://www.gogojungle.co.jp/tools/indicators/11836
MT5 comes with4-minute chart as standard.
AUD/JPY 4-minute chart
On the 4-minute chart above,Counter-trend line After breaking below, the rise mBDSR (2 RCI filters) Sell signal lights up and the price declines.
From this example, a trading approach focused on counter-trend lines and the harmony with mBDSR signals can be seen.
※ Please note that in charts introduced in this article, for convenience of explanation, circles, straight lines, and rectangles may have been drawn.
Indicators that shine in combination with RCI【BODSOR・mBDSR】
and methods & case studies (PDF) ★GogoJungle AWARD2020 Winner★
https://www.gogojungle.co.jp/tools/indicators/11836
The PDF file includes 358 files (over 1,400 pages, more than 470,000 characters in total).
Many of these areexamples that detail a method of logically linking higher and lower timeframes using 3 RCI lines, sequentially examining multiple lower-timeframe conditions, and ultimately waiting for a dip buy or pullback sell timing (the mBDSR signals) on the lower timeframe..
Additionally,there are many that emphasize pinpointing points where multiple entry reasons coincide..
Also included is a method for exploring upward and downward targets using the 3-RCI-line approach.
In the PDF explanations,there are over 1,350 charts used..
× ![]()


