

[MT5 Version] Double Top Neckline and mBDSR (RCI2 two-filter) Short-Selling Signal Return for GBP/NZD
================================
【Special Video vol.01/Blacksun】
https://www.gogojungle.co.jp/info/22955
【Special Video vol.02/Blacksun】
https://www.gogojungle.co.jp/info/22956
================================
The MT5 version Beta has been released!!
mBDSR (Product ID 11836) Purchase Bonus】MT5 Indicator (Beta) “mBDSR (no filter, RCI filter, MA filter)”
https://www.gogojungle.co.jp/tools/indicators/56765
【Master RCI!! Trend Reversal, Buy on Dips, Sell on Rallies】
An indicator that shines when combined with RCI【BODSOR・mBDSR】
and its methods and case studies (PDF) ★GogoJungle AWARD2020 Awardee★
https://www.gogojungle.co.jp/tools/indicators/11836
MT5includes6-hour timeframeas a standard option.
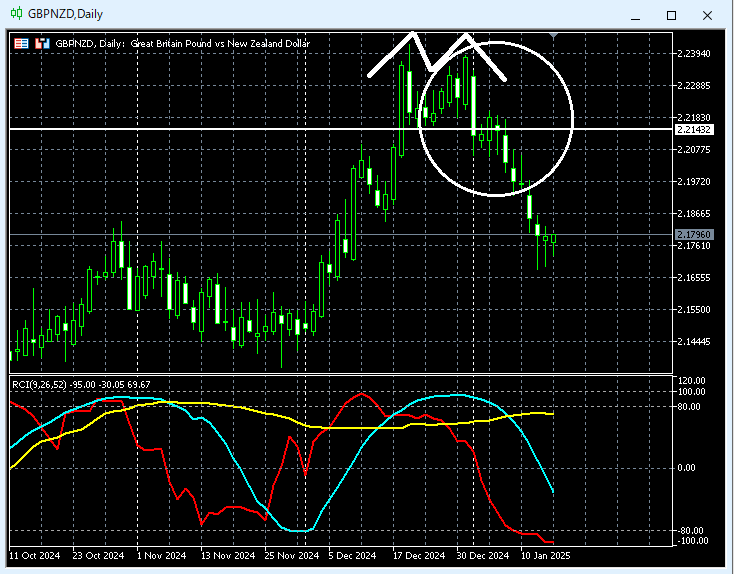
Pound-New Zealand GBPNZD Daily
Pound-New Zealand GBPNZD 6-hour
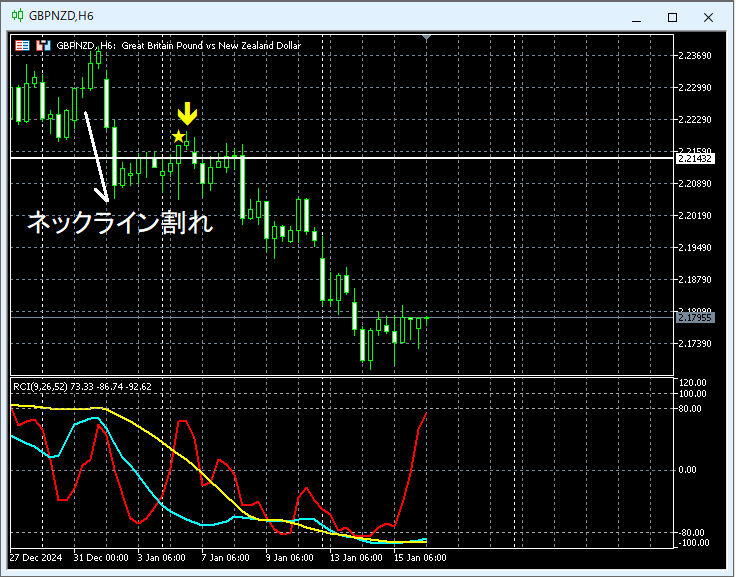
We will look at the area circled in white on the daily chart from the higher 6-hour chart.Neckline of the double topAfter breaking below, during the risemBDSR (RCI two-filter) shorting signallights up and the price moves lower.
From this example,a trading method focused on the double top and its neck lineandthe signals of mBDSRshow strong compatibility.
※Please note that in the charts introduced in this article, for convenience of explanation, circles, lines, and rectangles may be drawn.
An indicator that shines when combined with RCI【BODSOR・mBDSR】
and its methods and case studies (PDF) ★GogoJungle AWARD2020 Awardee★
https://www.gogojungle.co.jp/tools/indicators/11836
The PDF file includes 358 files (over 1,400 pages, over 470,000 words in total).
Many of them aresummaries of cases where using three RCI lines logically links higher and lower timeframes, sequentially examining multiple lower timeframes, and ultimately waiting for a dip buying or pullback selling timing (i.e., mBDSR signals) on the lower timeframes..
Also,many pieces focus on capturing points where multiple entry reasons coincide..
Additionally,there are methods exploring upward and downward targets using three-line RCI..
In the explanations within the PDF files,more than 1,350 chartsare used.

【Special Video vol.01/Blacksun】
https://www.gogojungle.co.jp/info/22955
【Special Video vol.02/Blacksun】
https://www.gogojungle.co.jp/info/22956
================================
The MT5 version Beta has been released!!
mBDSR (Product ID 11836) Purchase Bonus】MT5 Indicator (Beta) “mBDSR (no filter, RCI filter, MA filter)”
https://www.gogojungle.co.jp/tools/indicators/56765
【Master RCI!! Trend Reversal, Buy on Dips, Sell on Rallies】
An indicator that shines when combined with RCI【BODSOR・mBDSR】
and its methods and case studies (PDF) ★GogoJungle AWARD2020 Awardee★
https://www.gogojungle.co.jp/tools/indicators/11836
MT5includes6-hour timeframeas a standard option.
Pound-New Zealand GBPNZD Daily
Pound-New Zealand GBPNZD 6-hour
We will look at the area circled in white on the daily chart from the higher 6-hour chart.Neckline of the double topAfter breaking below, during the risemBDSR (RCI two-filter) shorting signallights up and the price moves lower.
From this example,a trading method focused on the double top and its neck lineandthe signals of mBDSRshow strong compatibility.
※Please note that in the charts introduced in this article, for convenience of explanation, circles, lines, and rectangles may be drawn.
An indicator that shines when combined with RCI【BODSOR・mBDSR】
and its methods and case studies (PDF) ★GogoJungle AWARD2020 Awardee★
https://www.gogojungle.co.jp/tools/indicators/11836
The PDF file includes 358 files (over 1,400 pages, over 470,000 words in total).
Many of them aresummaries of cases where using three RCI lines logically links higher and lower timeframes, sequentially examining multiple lower timeframes, and ultimately waiting for a dip buying or pullback selling timing (i.e., mBDSR signals) on the lower timeframes..
Also,many pieces focus on capturing points where multiple entry reasons coincide..
Additionally,there are methods exploring upward and downward targets using three-line RCI..
In the explanations within the PDF files,more than 1,350 chartsare used.
× ![]()


