

【MT5版】Breakout above previous return high and mBDSR (RCI 2-band filter) pullback buy signal EURAUD
【MT5 Version Beta】 has been released!!
mBDSR (Product ID 11836) Purchase Bonus】MT5 Version Indicator (Beta) "mBDSR (No filter, RCI filter, MA filter)"
https://www.gogojungle.co.jp/tools/indicators/56765
【Master RCI!! Trend reversal, Buy on dips, Sell on rallies】
An indicator【BODSOR・mBDSR】that shines when combined with RCI
and method / case studies (PDF) ★GogoJungle AWARD2020 Winner★
https://www.gogojungle.co.jp/tools/indicators/11836
MT5includes4-minute chartas the standard.
Euro/Oz EURAUD 4-minute chart
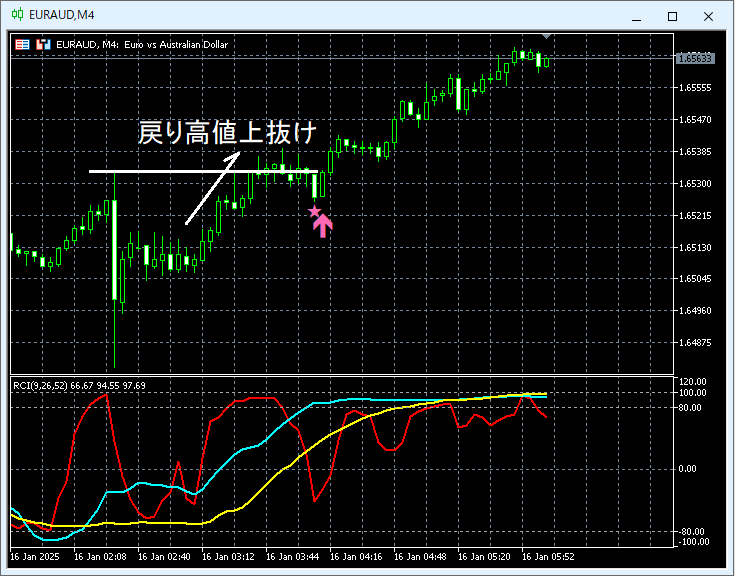
In the above 4-minute chart,Pullback highafter breaking abovemBDSR (2 RCI filters) buy signallights up and price rises.
From this example,a trading approach focused on Dow Theoryandthe harmony with mBDSR signalsare evident.
※Please note that in the charts introduced in this article, circles, lines, and rectangles may have been added for explanatory convenience.
An indicator that shines when combined with RCI【BODSOR・mBDSR】
and method / case studies (PDF) ★GogoJungle AWARD2020 Winner★
https://www.gogojungle.co.jp/tools/indicators/11836
The PDF file includes 358 documents (over 1,400 pages, over 470,000 characters in total).
Of these many documents,they describe a method that logically links higher and lower timeframes using three RCI lines, examines multiple lower timeframes step by step, and ultimately waits for the pullback buy or rally sell timing (i.e., mBDSR signals) on the lower timeframe.This is how it is laid out.
Also,many of the documents emphasize identifying points where multiple entry reasons align..
Additionally,methods for exploring upside and downside targets using three RCI lines are included..
In the PDF explanations,more than 1,350 chartsare used.

mBDSR (Product ID 11836) Purchase Bonus】MT5 Version Indicator (Beta) "mBDSR (No filter, RCI filter, MA filter)"
https://www.gogojungle.co.jp/tools/indicators/56765
【Master RCI!! Trend reversal, Buy on dips, Sell on rallies】
An indicator【BODSOR・mBDSR】that shines when combined with RCI
and method / case studies (PDF) ★GogoJungle AWARD2020 Winner★
https://www.gogojungle.co.jp/tools/indicators/11836
MT5includes4-minute chartas the standard.
Euro/Oz EURAUD 4-minute chart
In the above 4-minute chart,Pullback highafter breaking abovemBDSR (2 RCI filters) buy signallights up and price rises.
From this example,a trading approach focused on Dow Theoryandthe harmony with mBDSR signalsare evident.
※Please note that in the charts introduced in this article, circles, lines, and rectangles may have been added for explanatory convenience.
An indicator that shines when combined with RCI【BODSOR・mBDSR】
and method / case studies (PDF) ★GogoJungle AWARD2020 Winner★
https://www.gogojungle.co.jp/tools/indicators/11836
The PDF file includes 358 documents (over 1,400 pages, over 470,000 characters in total).
Of these many documents,they describe a method that logically links higher and lower timeframes using three RCI lines, examines multiple lower timeframes step by step, and ultimately waits for the pullback buy or rally sell timing (i.e., mBDSR signals) on the lower timeframe.This is how it is laid out.
Also,many of the documents emphasize identifying points where multiple entry reasons align..
Additionally,methods for exploring upside and downside targets using three RCI lines are included..
In the PDF explanations,more than 1,350 chartsare used.
× ![]()


