

[MT5 Version] mBDSR (RCI2 本フィルター) Buy Signal for Dollar Yen
【MT5 Version Beta】 has been released!!
mBDSR (Product ID 11836) Purchase Bonus】 MT5 Version Indicator (Beta) "mBDSR (no filter, RCI filter, MA filter)"
https://www.gogojungle.co.jp/tools/indicators/56765
【Master RCI!! Trend Reversal, Buy on Dips, Sell on Rallies】
An indicator that shines when used in combination with RCI【BODSOR・mBDSR】
and techniques & case studies (PDF) ★GogoJungle AWARD2020 Winner★
https://www.gogojungle.co.jp/tools/indicators/11836
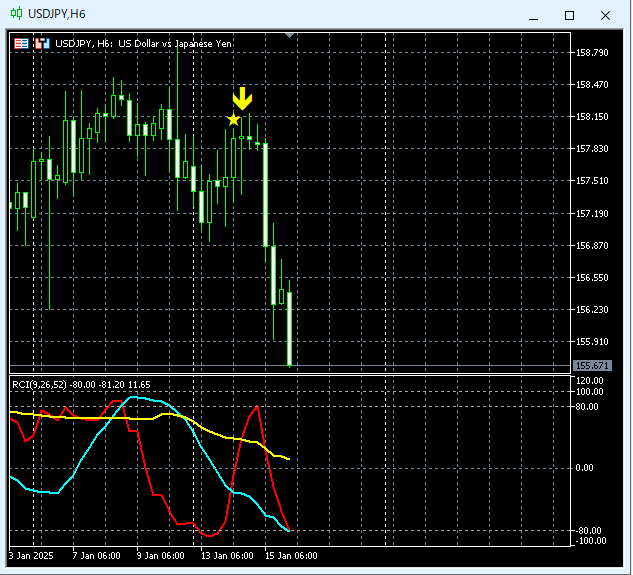
MT5includes6-hour chartas standard.
USDJPY 6-hour chart
An indicator that shines when used in combination with RCI【BODSOR・mBDSR】
and techniques & case studies (PDF) ★GogoJungle AWARD2020 Winner★
https://www.gogojungle.co.jp/tools/indicators/11836
The PDF file includes 358 items (over 1,400 pages, over 470,000 characters).
Many of them are examples that describe how to logically link higher and lower timeframes using the three-line RCI, and ultimately wait for dip buying or pullback selling timing (the mBDSR signal) on the lower timeframe.
Additionally,there are many that emphasize identifying points where multiple entry reasons overlap..
Also included is a method to explore upside and downside targets using the three-line RCI.
In the PDF explanations,more than 1,350 chartsare used.

mBDSR (Product ID 11836) Purchase Bonus】 MT5 Version Indicator (Beta) "mBDSR (no filter, RCI filter, MA filter)"
https://www.gogojungle.co.jp/tools/indicators/56765
【Master RCI!! Trend Reversal, Buy on Dips, Sell on Rallies】
An indicator that shines when used in combination with RCI【BODSOR・mBDSR】
and techniques & case studies (PDF) ★GogoJungle AWARD2020 Winner★
https://www.gogojungle.co.jp/tools/indicators/11836
MT5includes6-hour chartas standard.
USDJPY 6-hour chart
An indicator that shines when used in combination with RCI【BODSOR・mBDSR】
and techniques & case studies (PDF) ★GogoJungle AWARD2020 Winner★
https://www.gogojungle.co.jp/tools/indicators/11836
The PDF file includes 358 items (over 1,400 pages, over 470,000 characters).
Many of them are examples that describe how to logically link higher and lower timeframes using the three-line RCI, and ultimately wait for dip buying or pullback selling timing (the mBDSR signal) on the lower timeframe.
Additionally,there are many that emphasize identifying points where multiple entry reasons overlap..
Also included is a method to explore upside and downside targets using the three-line RCI.
In the PDF explanations,more than 1,350 chartsare used.
× ![]()


