

[Aiming to Master RCI!! AUDJPY] Break above the recent high and the pullback buying signal with mBDSR (RCI double-filter)
====================
【Special Video vol.01/Blacksun】
https://www.gogojungle.co.jp/info/22955
【Special Video vol.02/Blacksun】
https://www.gogojungle.co.jp/info/22956
【Special Video vol.03/Blacksun】
https://www.gogojungle.co.jp/info/22957
====================
【MT5 Version Beta】 has been released!!
mBDSR (Product ID 11836) Purchase Benefit】 MT5 Version Indicator (Beta) “mBDSR (no filter, RCI filter, MA filter)”
https://www.gogojungle.co.jp/tools/indicators/56765
【Master RCI!! Trend Reversal, Buy on Dips, Sell on Rallies】
An indicator that shines when combined with RCI【BODSOR・mBDSR】
and Method / Case Studies (PDF) ★GogoJungle AWARD2020 Winner★
https://www.gogojungle.co.jp/tools/indicators/11836
AUD/JPY 15-minute chart
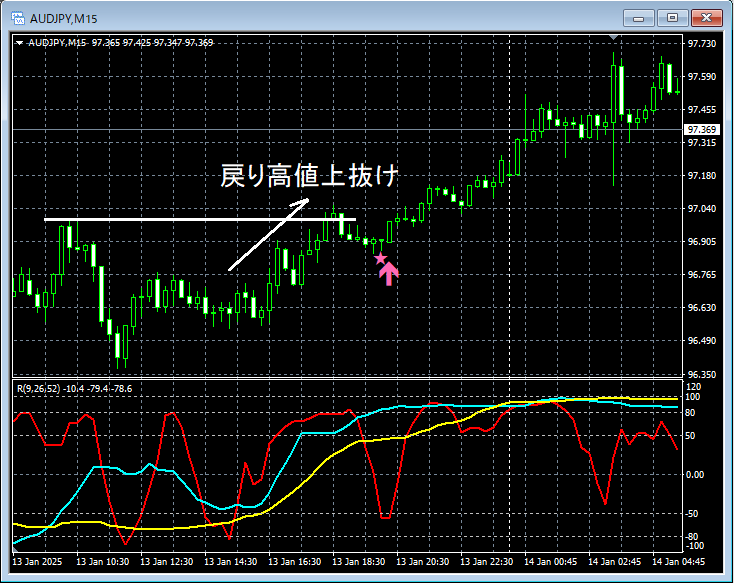
In the 15-minute chart above, it rebounded from a downtrend. Thenthe high of the retracementbroke above and then declinedthe mBDSR dip-buy signal (filters: RCI26 and RCI52)lit up and the price rose steadily.
From this example,a trading method focusing on retracement highs (Dow Theory)andthe signals of mBDSRshow a high degree of compatibility.
※Please note that in the charts presented in this article, circles, lines, and rectangles may have been added for explanatory convenience.
An indicator that shines when combined with RCI【BODSOR・mBDSR】
and Method / Case Studies (PDF) ★GogoJungle AWARD2020 Winner★
https://www.gogojungle.co.jp/tools/indicators/11836
The PDF file includes 358 items (over 1,400 pages, over 470,000 characters in total).
Most of these aresummaries of cases where, by linking higher and lower timeframes logically using three RCI lines, one examines the conditions of multiple lower timeframes step by step, ultimately waiting for the dip-buying timing or retracement timing (the mBDSR signal) on the lower timeframes..
In addition,many entries focus on identifying points where multiple entry reasons overlap.
Furthermore,there are also methods that explore upward or downward targets using three RCI lines..
In the PDF explanations,there are more than 1,350 charts used..

【Special Video vol.01/Blacksun】
https://www.gogojungle.co.jp/info/22955
【Special Video vol.02/Blacksun】
https://www.gogojungle.co.jp/info/22956
【Special Video vol.03/Blacksun】
https://www.gogojungle.co.jp/info/22957
====================
【MT5 Version Beta】 has been released!!
mBDSR (Product ID 11836) Purchase Benefit】 MT5 Version Indicator (Beta) “mBDSR (no filter, RCI filter, MA filter)”
https://www.gogojungle.co.jp/tools/indicators/56765
【Master RCI!! Trend Reversal, Buy on Dips, Sell on Rallies】
An indicator that shines when combined with RCI【BODSOR・mBDSR】
and Method / Case Studies (PDF) ★GogoJungle AWARD2020 Winner★
https://www.gogojungle.co.jp/tools/indicators/11836
AUD/JPY 15-minute chart
In the 15-minute chart above, it rebounded from a downtrend. Thenthe high of the retracementbroke above and then declinedthe mBDSR dip-buy signal (filters: RCI26 and RCI52)lit up and the price rose steadily.
From this example,a trading method focusing on retracement highs (Dow Theory)andthe signals of mBDSRshow a high degree of compatibility.
※Please note that in the charts presented in this article, circles, lines, and rectangles may have been added for explanatory convenience.
An indicator that shines when combined with RCI【BODSOR・mBDSR】
and Method / Case Studies (PDF) ★GogoJungle AWARD2020 Winner★
https://www.gogojungle.co.jp/tools/indicators/11836
The PDF file includes 358 items (over 1,400 pages, over 470,000 characters in total).
Most of these aresummaries of cases where, by linking higher and lower timeframes logically using three RCI lines, one examines the conditions of multiple lower timeframes step by step, ultimately waiting for the dip-buying timing or retracement timing (the mBDSR signal) on the lower timeframes..
In addition,many entries focus on identifying points where multiple entry reasons overlap.
Furthermore,there are also methods that explore upward or downward targets using three RCI lines..
In the PDF explanations,there are more than 1,350 charts used..
× ![]()


