

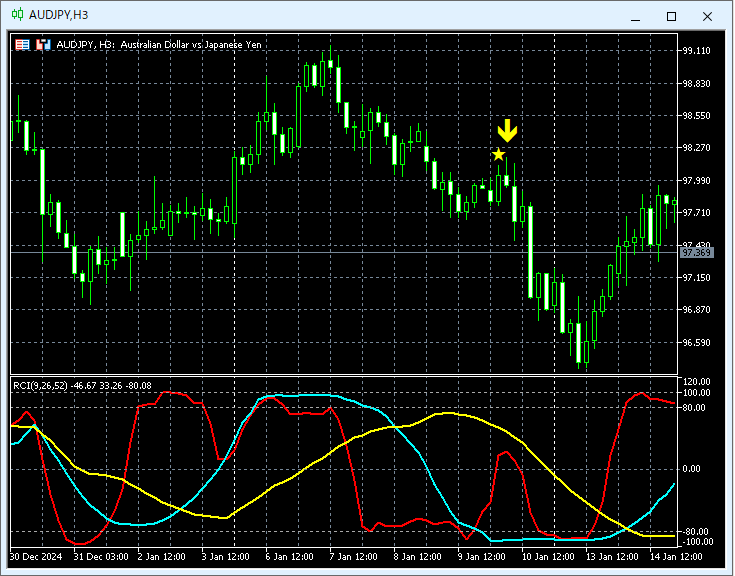
[MT5 Version] mBDSR (RCI2 Genuine Filter) Bearish Signal AUD/JPY
【MT5版 Beta】 has been released!!
mBDSR (Product ID 11836) Purchase Bonus】 MT5 Version Indicator (Beta) “mBDSR (no filter, RCI filter, MA filter)”
https://www.gogojungle.co.jp/tools/indicators/56765
【Master RCI!! Trend reversal, pullback buying, and selling the rebound】
An indicator that shines when combined with RCI【BODSOR・mBDSR】
and techniques / case studies (PDF) ★GogoJungle AWARD2020 winner★
https://www.gogojungle.co.jp/tools/indicators/11836
MT5provides standard already for3-hour chartas standard.
AUDJPY 3-hour chart
An indicator that shines when combined with RCI【BODSOR・mBDSR】
and techniques / case studies (PDF) ★GogoJungle AWARD2020 winner★
https://www.gogojungle.co.jp/tools/indicators/11836
The PDF file comes with 358 items (over 1,400 pages, over 470,000 words).
Most of them are about how to logically link higher Timeframes with lower Timeframes using the three RCI lines, and ultimately determine signals from lower timeframes for pullback buying or selling the rebound (the mBDSR signal).
Also,many focus points are on capturing overlapping entry reasons.There are many such examples.
Additionally,there are methods that explore ascent and descent potentials using the three RCI lines.Also included.
In the PDF explanations,over 1,350 chartsare used.
× ![]()


