

[MT5 Version] mBDSR (RCI2 Full Filter) Signal Bitcoin BTCUSD
【MT5版 ベータ版】 has been released!!
mBDSR (Product ID 11836) Purchase Bonus】 MT5 version Indicator (Beta) “mBDSR (no filter, RCI filter, MA filter)”
https://www.gogojungle.co.jp/tools/indicators/56765
【Master RCI!! Trend reversal, Buy the dip, Sell the retrace】
Indicator that shines when used in combination with RCI【BODSOR・mBDSR】
Methods & Case Studies (PDF) ★GogoJungle AWARD 2020 Winner★
https://www.gogojungle.co.jp/tools/indicators/11836
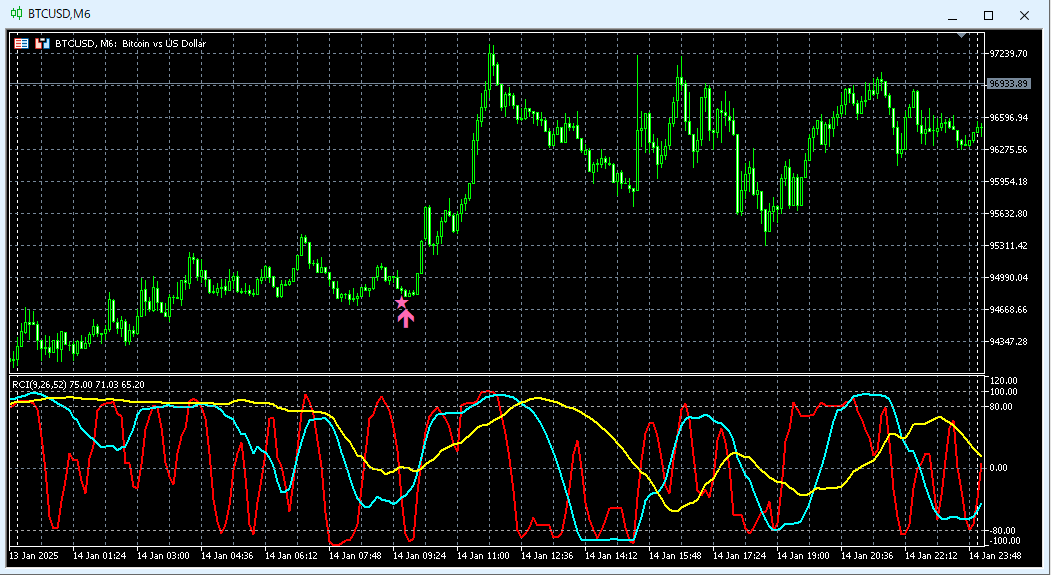
MT5 provides6-minute chart as the standard.
Bitcoin / USD BTCUSD 6-minute chart
Indicator that shines when used in combination with RCI【BODSOR・mBDSR】
Methods & Case Studies (PDF) ★GogoJungle AWARD 2020 Winner★
https://www.gogojungle.co.jp/tools/indicators/11836
The PDF file includes 358 pieces (over 1,400 pages, over 470,000 characters).
Many of them are focused onlinking higher timeframes and lower timeframes logically using three RCI lines, and ultimately detailing examples where one waits for the dip buy or pullback sell timing on the lower timeframe (i.e., the mBDSR signal)..
Also,many focus on identifying points where multiple entry reasons align..
Additionally,the method to explore rise and fall targets using the three-line RCI is included..
In the PDF explanations,the charts exceed 1,350 sheets are used.

mBDSR (Product ID 11836) Purchase Bonus】 MT5 version Indicator (Beta) “mBDSR (no filter, RCI filter, MA filter)”
https://www.gogojungle.co.jp/tools/indicators/56765
【Master RCI!! Trend reversal, Buy the dip, Sell the retrace】
Indicator that shines when used in combination with RCI【BODSOR・mBDSR】
Methods & Case Studies (PDF) ★GogoJungle AWARD 2020 Winner★
https://www.gogojungle.co.jp/tools/indicators/11836
MT5 provides6-minute chart as the standard.
Bitcoin / USD BTCUSD 6-minute chart
Indicator that shines when used in combination with RCI【BODSOR・mBDSR】
Methods & Case Studies (PDF) ★GogoJungle AWARD 2020 Winner★
https://www.gogojungle.co.jp/tools/indicators/11836
The PDF file includes 358 pieces (over 1,400 pages, over 470,000 characters).
Many of them are focused onlinking higher timeframes and lower timeframes logically using three RCI lines, and ultimately detailing examples where one waits for the dip buy or pullback sell timing on the lower timeframe (i.e., the mBDSR signal)..
Also,many focus on identifying points where multiple entry reasons align..
Additionally,the method to explore rise and fall targets using the three-line RCI is included..
In the PDF explanations,the charts exceed 1,350 sheets are used.
× ![]()


