

Mastering RCI: Yesterday (2025/01/14) AUD/JPY [MT5版] mBDSR (RCI two-filter) dip-buy signal and pullback-sell signal
【MT5 Version Beta】 has been released!!
mBDSR (Product ID 11836) Purchase Bonus】MT5 Version Indicator (Beta) “mBDSR (no filter, RCI filter, MA filter)”
https://www.gogojungle.co.jp/tools/indicators/56765
【Master RCI!! Trend reversal, Buy on dips, Sell on rallies】
An indicator that shines when combined with RCI: 【BODSOR・mBDSR】
and methods & case studies (PDF) ★GogoJungle AWARD2020 winner★
https://www.gogojungle.co.jp/tools/indicators/11836
MT5 version3-minute chart and4-minute chart are provided as standard.
AUDJPY (Australian Dollar / Japanese Yen) 4-minute chart
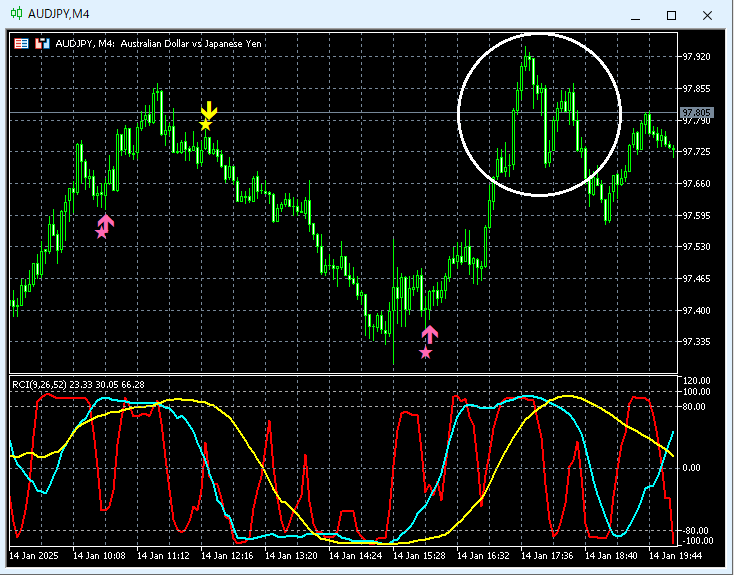
On the top 4-minute chart, at the area encircled in white, the signal is lit up on the lower 3-minute chart.
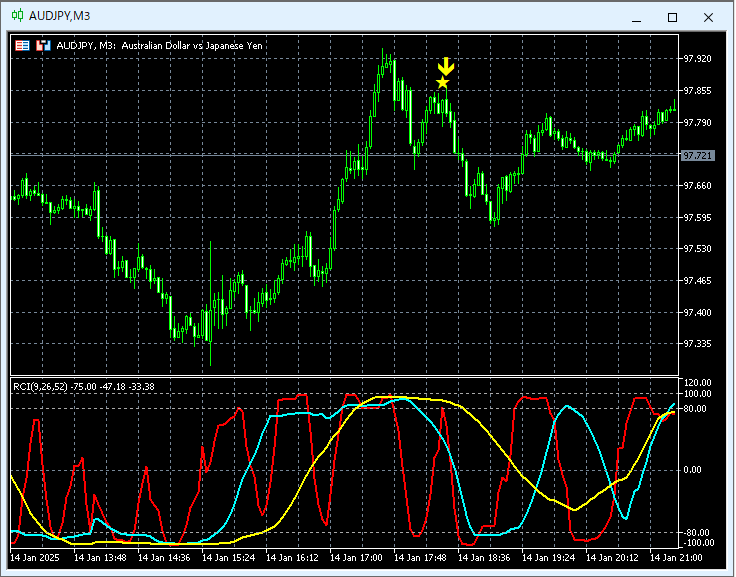
AUDJPY 3-minute chart
An indicator that shines when combined with RCI: 【BODSOR・mBDSR】
and methods & case studies (PDF) ★GogoJungle AWARD2020 winner★
https://www.gogojungle.co.jp/tools/indicators/11836
The PDF file includes 358 documents (over 1,400 pages, over 470,000 characters in total).
Many of them are abouta collection of examples where the upper and lower timeframes are logically linked using the three-line RCI, sequentially considering the conditions of multiple lower timeframes, and ultimately waiting for pullback buy or pullback sell timings (i.e., mBDSR signals) on the lower timeframe.
Additionally,many focus on identifying points where multiple entry reasons converge.
Also included is a method for exploring upside and downside targets using three-line RCI..
In the PDF explanations,over 1,350 chartsare used.

mBDSR (Product ID 11836) Purchase Bonus】MT5 Version Indicator (Beta) “mBDSR (no filter, RCI filter, MA filter)”
https://www.gogojungle.co.jp/tools/indicators/56765
【Master RCI!! Trend reversal, Buy on dips, Sell on rallies】
An indicator that shines when combined with RCI: 【BODSOR・mBDSR】
and methods & case studies (PDF) ★GogoJungle AWARD2020 winner★
https://www.gogojungle.co.jp/tools/indicators/11836
MT5 version3-minute chart and4-minute chart are provided as standard.
AUDJPY (Australian Dollar / Japanese Yen) 4-minute chart
On the top 4-minute chart, at the area encircled in white, the signal is lit up on the lower 3-minute chart.
AUDJPY 3-minute chart
An indicator that shines when combined with RCI: 【BODSOR・mBDSR】
and methods & case studies (PDF) ★GogoJungle AWARD2020 winner★
https://www.gogojungle.co.jp/tools/indicators/11836
The PDF file includes 358 documents (over 1,400 pages, over 470,000 characters in total).
Many of them are abouta collection of examples where the upper and lower timeframes are logically linked using the three-line RCI, sequentially considering the conditions of multiple lower timeframes, and ultimately waiting for pullback buy or pullback sell timings (i.e., mBDSR signals) on the lower timeframe.
Additionally,many focus on identifying points where multiple entry reasons converge.
Also included is a method for exploring upside and downside targets using three-line RCI..
In the PDF explanations,over 1,350 chartsare used.
× ![]()


