

[MT5 Version] mBDSR (RCI2 Full Filter) Signal - Bitcoin BTCUSD
【MT5 Version Beta】 has been released!!
mBDSR (Product ID 11836) Purchase Bonus】 MT5 Version Indicator (Beta) "mBDSR (No Filter, RCI Filter, MA Filter)"
https://www.gogojungle.co.jp/tools/indicators/56765
【Master RCI!! Trend Reversal, Buy on Dips, Sell on Rallies】
An indicator that shines when combined with RCI【BODSOR・mBDSR】
and methods・case studies (PDF) ★GogoJungle AWARD2020 Winner★
https://www.gogojungle.co.jp/tools/indicators/11836
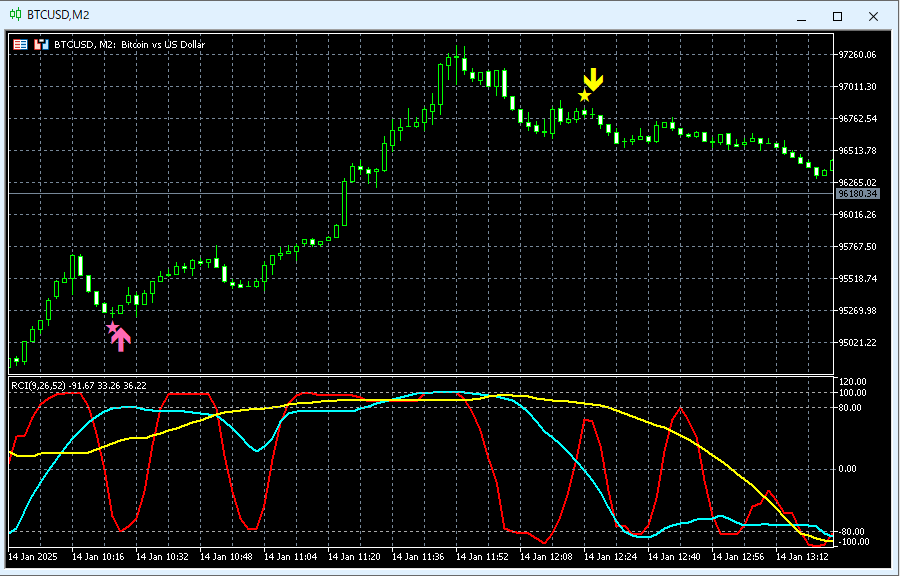
MT5includes2-minute chartas the standard
Bitcoin / US Dollar BTCUSD 2-minute chart
An indicator that shines when combined with RCI【BODSOR・mBDSR】
and methods・case studies (PDF) ★GogoJungle AWARD2020 Winner★
https://www.gogojungle.co.jp/tools/indicators/11836
A PDF file is included with 358 pieces (over 1,400 pages, over 470,000 words).
Many of them areexamples that detail linking higher and lower timeframes logically using the three-line RCI, and ultimately waiting for dip buys or pullback sells on the lower timeframe (i.e., the mBDSR signal).in summary.
Also,many focus on identifying points where multiple entry reasons overlap..
Additionally,there are methods that explore upside potential and downside potential using the three-line RCI..
In the PDF explanations,over 1,350 charts are used.

mBDSR (Product ID 11836) Purchase Bonus】 MT5 Version Indicator (Beta) "mBDSR (No Filter, RCI Filter, MA Filter)"
https://www.gogojungle.co.jp/tools/indicators/56765
【Master RCI!! Trend Reversal, Buy on Dips, Sell on Rallies】
An indicator that shines when combined with RCI【BODSOR・mBDSR】
and methods・case studies (PDF) ★GogoJungle AWARD2020 Winner★
https://www.gogojungle.co.jp/tools/indicators/11836
MT5includes2-minute chartas the standard
Bitcoin / US Dollar BTCUSD 2-minute chart
An indicator that shines when combined with RCI【BODSOR・mBDSR】
and methods・case studies (PDF) ★GogoJungle AWARD2020 Winner★
https://www.gogojungle.co.jp/tools/indicators/11836
A PDF file is included with 358 pieces (over 1,400 pages, over 470,000 words).
Many of them areexamples that detail linking higher and lower timeframes logically using the three-line RCI, and ultimately waiting for dip buys or pullback sells on the lower timeframe (i.e., the mBDSR signal).in summary.
Also,many focus on identifying points where multiple entry reasons overlap..
Additionally,there are methods that explore upside potential and downside potential using the three-line RCI..
In the PDF explanations,over 1,350 charts are used.
× ![]()


