

[MT5 Version] Targeting Trend Reversals!! Sell signals on the pullback with mBDSR (RCI2 two-filter)
【MT5 Version Beta】 has been released!!
mBDSR (Product ID 11836) Purchase Bonus】MT5 version indicator (Beta) "mBDSR (no filter, RCI filter, MA filter)"
https://www.gogojungle.co.jp/tools/indicators/56765
【Master RCI!! Trend Reversal, Buy the Dip, Sell the Rally】
Indicator that shines when combined with RCI【BODSOR・mBDSR】
Methods & Case Studies (PDF) ★GogoJungle AWARD2020 Winner★
https://www.gogojungle.co.jp/tools/indicators/11836
MT5 includes2-minute chart as the standard available chart.
AUD/USD 2-minute chart
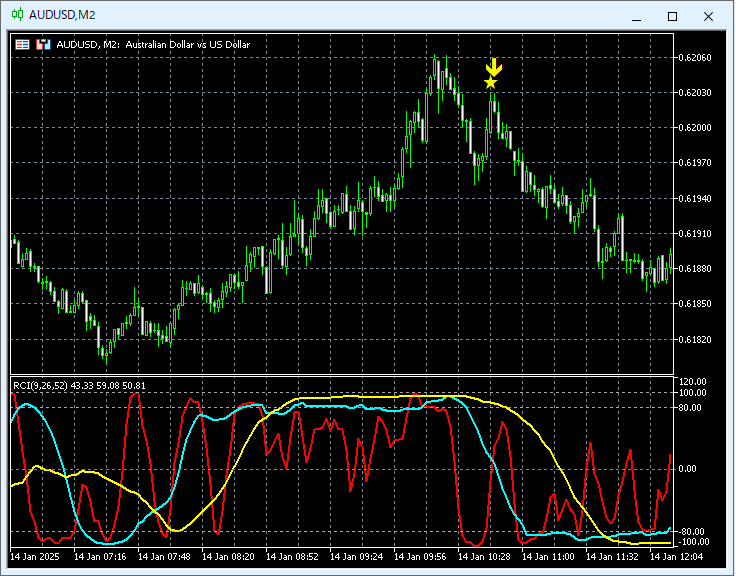
Looking at the 2-minute chart above,mBDSR (RCI two-filter) Sell signal captures the timing of the downturn well.
Indicator that shines when combined with RCI【BODSOR・mBDSR】
Methods & Case Studies (PDF) ★GogoJungle AWARD2020 Winner★
https://www.gogojungle.co.jp/tools/indicators/11836
The PDF file includes 358 files (over 1,400 pages, over 470,000 characters).
Most of themoutline how to logically link higher and lower timeframes using three RCI lines, sequentially examining multiple lower-timeframe conditions, and finally waiting for dip buys or pullback sells on the lower timeframes (i.e., signals from mBDSR)..
Additionally,many of them emphasize identifying points where multiple entry signals align..
Also included is a method for exploring upside and downside targets using three RCI lines.
In the PDF explanations,over 1,350 charts are used.

mBDSR (Product ID 11836) Purchase Bonus】MT5 version indicator (Beta) "mBDSR (no filter, RCI filter, MA filter)"
https://www.gogojungle.co.jp/tools/indicators/56765
【Master RCI!! Trend Reversal, Buy the Dip, Sell the Rally】
Indicator that shines when combined with RCI【BODSOR・mBDSR】
Methods & Case Studies (PDF) ★GogoJungle AWARD2020 Winner★
https://www.gogojungle.co.jp/tools/indicators/11836
MT5 includes2-minute chart as the standard available chart.
AUD/USD 2-minute chart
Looking at the 2-minute chart above,mBDSR (RCI two-filter) Sell signal captures the timing of the downturn well.
Indicator that shines when combined with RCI【BODSOR・mBDSR】
Methods & Case Studies (PDF) ★GogoJungle AWARD2020 Winner★
https://www.gogojungle.co.jp/tools/indicators/11836
The PDF file includes 358 files (over 1,400 pages, over 470,000 characters).
Most of themoutline how to logically link higher and lower timeframes using three RCI lines, sequentially examining multiple lower-timeframe conditions, and finally waiting for dip buys or pullback sells on the lower timeframes (i.e., signals from mBDSR)..
Additionally,many of them emphasize identifying points where multiple entry signals align..
Also included is a method for exploring upside and downside targets using three RCI lines.
In the PDF explanations,over 1,350 charts are used.
× ![]()


