

Double Top near the Important Moving Average and the Sign of mBDSR (RCI two-filter)
============================
【Special Video vol.01/Blacksun】
https://www.gogojungle.co.jp/info/22955
【Special Video vol.02/Blacksun】
https://www.gogojungle.co.jp/info/22956
【Special Video vol.03/Blacksun】
https://www.gogojungle.co.jp/info/22957
============================
【MT5 Version Beta】 has been released!!
mBDSR (Product ID 11836) Purchase Bonus】MT5 Indicator (Beta) “mBDSR (No Filter, RCI Filter, MA Filter)”
https://www.gogojungle.co.jp/tools/indicators/56765
An indicator that shines when combined with RCI【BODSOR・mBDSR】
and its methods & case studies (PDF) ★GogoJungle AWARD2020 winner★
https://www.gogojungle.co.jp/tools/indicators/11836
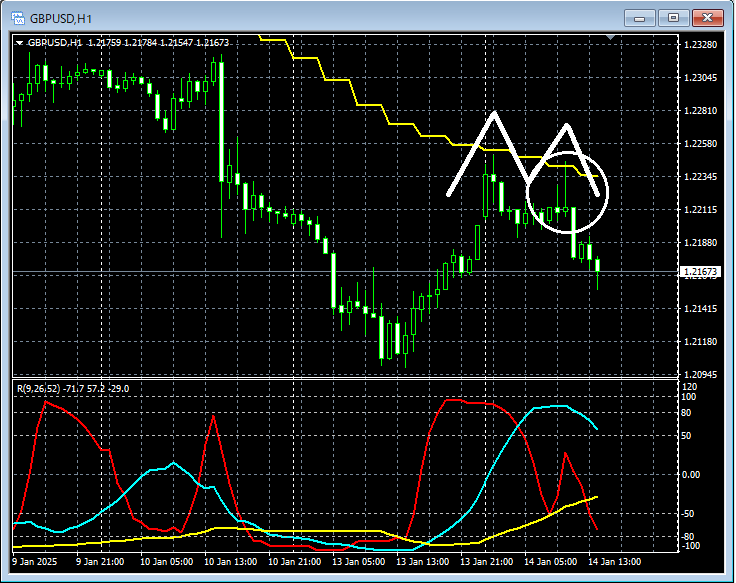
GBPUSD 1-hour chart
GBPUSD 1-minute chart
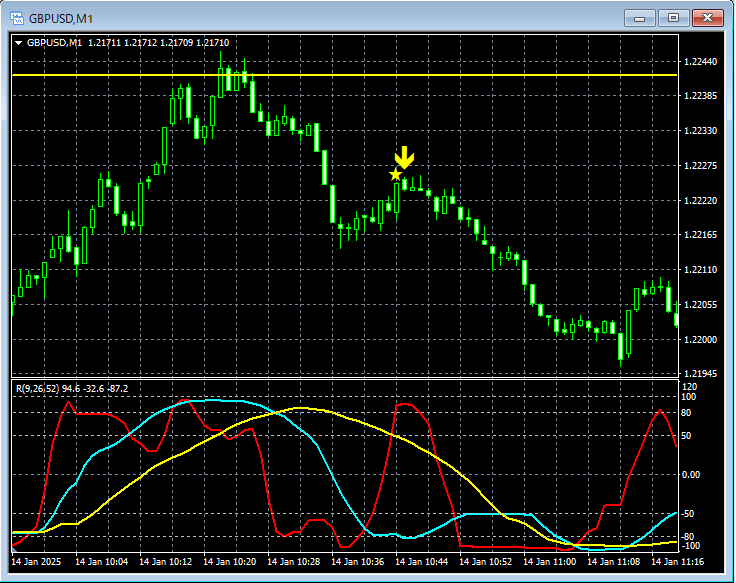
4-hour EMA21Near the 1-hour chartDouble Topthe right-side peak and the timing of the start of the decline on the 1-minute chart'smBDSR (RCI two-filter) pullback signalis well captured.
From this example,the trading method that focuses on key moving averages and double topsandmBDSR signalsdemonstrates a high degree of compatibility.
Additionally, in this example, placing the stop-loss slightly above the most recent high (the left peak of the double top)allows for high risk-reward trades.
※ Please note that in the charts shown in this article, for convenience of explanation, circles, lines, and squares may have been added.
An indicator that shines when combined with RCI【BODSOR・mBDSR】
and its methods & case studies (PDF) ★GogoJungle AWARD2020 winner★
https://www.gogojungle.co.jp/tools/indicators/11836
The PDF file includes 358 documents (over 1,400 pages, over 470,000 characters).
Most of them aresummaries of how logically linking higher and lower timeframes using three RCI lines allows analyzing multiple lower timeframes step by step, ultimately waiting for pullbacks or rallies on the lower timeframe (i.e., the mBDSR signal)..
Also,many focus on identifying points where multiple entry criteria overlap..
Additionally,there are methods that explore ascent and descent targets using three RCI lines..
In the descriptions within the PDF files,more than 1,350 chartsare used.

【Special Video vol.01/Blacksun】
https://www.gogojungle.co.jp/info/22955
【Special Video vol.02/Blacksun】
https://www.gogojungle.co.jp/info/22956
【Special Video vol.03/Blacksun】
https://www.gogojungle.co.jp/info/22957
============================
【MT5 Version Beta】 has been released!!
mBDSR (Product ID 11836) Purchase Bonus】MT5 Indicator (Beta) “mBDSR (No Filter, RCI Filter, MA Filter)”
https://www.gogojungle.co.jp/tools/indicators/56765
An indicator that shines when combined with RCI【BODSOR・mBDSR】
and its methods & case studies (PDF) ★GogoJungle AWARD2020 winner★
https://www.gogojungle.co.jp/tools/indicators/11836
GBPUSD 1-hour chart
GBPUSD 1-minute chart
4-hour EMA21Near the 1-hour chartDouble Topthe right-side peak and the timing of the start of the decline on the 1-minute chart'smBDSR (RCI two-filter) pullback signalis well captured.
From this example,the trading method that focuses on key moving averages and double topsandmBDSR signalsdemonstrates a high degree of compatibility.
Additionally, in this example, placing the stop-loss slightly above the most recent high (the left peak of the double top)allows for high risk-reward trades.
※ Please note that in the charts shown in this article, for convenience of explanation, circles, lines, and squares may have been added.
An indicator that shines when combined with RCI【BODSOR・mBDSR】
and its methods & case studies (PDF) ★GogoJungle AWARD2020 winner★
https://www.gogojungle.co.jp/tools/indicators/11836
The PDF file includes 358 documents (over 1,400 pages, over 470,000 characters).
Most of them aresummaries of how logically linking higher and lower timeframes using three RCI lines allows analyzing multiple lower timeframes step by step, ultimately waiting for pullbacks or rallies on the lower timeframe (i.e., the mBDSR signal)..
Also,many focus on identifying points where multiple entry criteria overlap..
Additionally,there are methods that explore ascent and descent targets using three RCI lines..
In the descriptions within the PDF files,more than 1,350 chartsare used.
× ![]()


