

[MT5 Version] Aiming for Trend Reversal!! Short-sell signal on the mBDSR (RCI2 double-filter) pullback
【MT5 Version Beta】 has been released!!
mBDSR (Product ID 11836) Purchase Bonus】 MT5 Version Indicator (Beta) “mBDSR (No Filter, RCI Filter, MA Filter)”
https://www.gogojungle.co.jp/tools/indicators/56765
【Master RCI!! Trend Reversal, Buy on Dips, Sell on Rallies】
Indicator with powerful performance when combined with RCI【BODSOR・mBDSR】
Methods & Case Studies (PDF) ★GogoJungle AWARD2020 Winner★
https://www.gogojungle.co.jp/tools/indicators/11836
MT5 provides10-minute chart as the standard.
USD/CAD USDCAD 10-minute chart
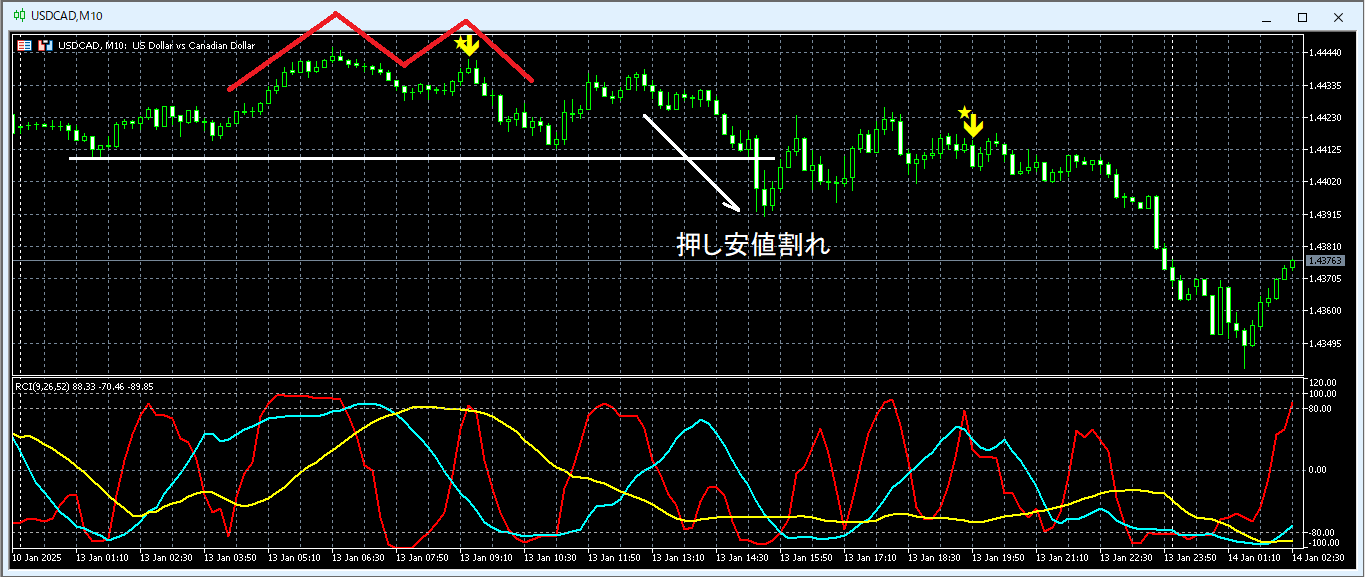
The first signal is,Double Top capturing the timing of the decline on the right peak.
The second signal is,Break of the swing low (defining a breakout after an uptrend) capturing the timing of the decline after an ascent.
Indicator with powerful performance when combined with RCI【BODSOR・mBDSR】
Methods & Case Studies (PDF) ★GogoJungle AWARD2020 Winner★
https://www.gogojungle.co.jp/tools/indicators/11836
The PDF file includes 358 files (over 1,400 pages, over 470,000 characters).
Many of them are aboutexploring multiple lower-timeframe conditions by logically linking higher and lower timeframes using three RCI lines, and ultimately outlining the approach of waiting for dips/breakouts signals on the lower timeframes (i.e., mBDSR signals)..
Also,there are many that emphasize identifying points where multiple entry reasons coincide..
In addition,there is also a method to explore upside and downside targets using three RCI lines..
In the PDF descriptions,over 1,350 charts are used.

mBDSR (Product ID 11836) Purchase Bonus】 MT5 Version Indicator (Beta) “mBDSR (No Filter, RCI Filter, MA Filter)”
https://www.gogojungle.co.jp/tools/indicators/56765
【Master RCI!! Trend Reversal, Buy on Dips, Sell on Rallies】
Indicator with powerful performance when combined with RCI【BODSOR・mBDSR】
Methods & Case Studies (PDF) ★GogoJungle AWARD2020 Winner★
https://www.gogojungle.co.jp/tools/indicators/11836
MT5 provides10-minute chart as the standard.
USD/CAD USDCAD 10-minute chart
The first signal is,Double Top capturing the timing of the decline on the right peak.
The second signal is,Break of the swing low (defining a breakout after an uptrend) capturing the timing of the decline after an ascent.
Indicator with powerful performance when combined with RCI【BODSOR・mBDSR】
Methods & Case Studies (PDF) ★GogoJungle AWARD2020 Winner★
https://www.gogojungle.co.jp/tools/indicators/11836
The PDF file includes 358 files (over 1,400 pages, over 470,000 characters).
Many of them are aboutexploring multiple lower-timeframe conditions by logically linking higher and lower timeframes using three RCI lines, and ultimately outlining the approach of waiting for dips/breakouts signals on the lower timeframes (i.e., mBDSR signals)..
Also,there are many that emphasize identifying points where multiple entry reasons coincide..
In addition,there is also a method to explore upside and downside targets using three RCI lines..
In the PDF descriptions,over 1,350 charts are used.
× ![]()


