

[MT5 Version] mBDSR (RCI2 Inner Filter) Buy Signal Example
【MT5 Version Beta】 has been released!!
mBDSR (Product ID 11836) Purchase Bonus】 MT5 Version Indicator (Beta) “mBDSR (no filter, RCI filter, MA filter)”
https://www.gogojungle.co.jp/tools/indicators/56765
【Master RCI!! Trend reversal, Buy on dips, Sell on rallies】
An indicator that shines in combination with RCI【BODSOR・mBDSR】
and methods / case studies (PDF) ★GogoJungle AWARD2020 winner★
https://www.gogojungle.co.jp/tools/indicators/11836
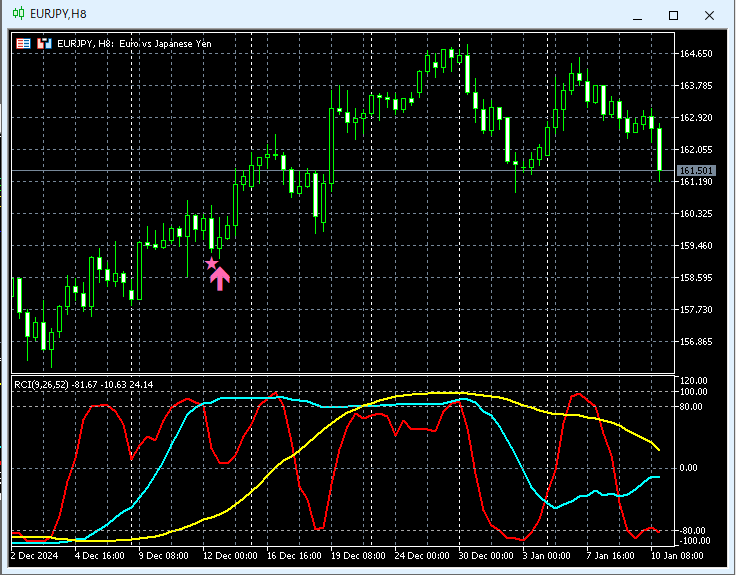
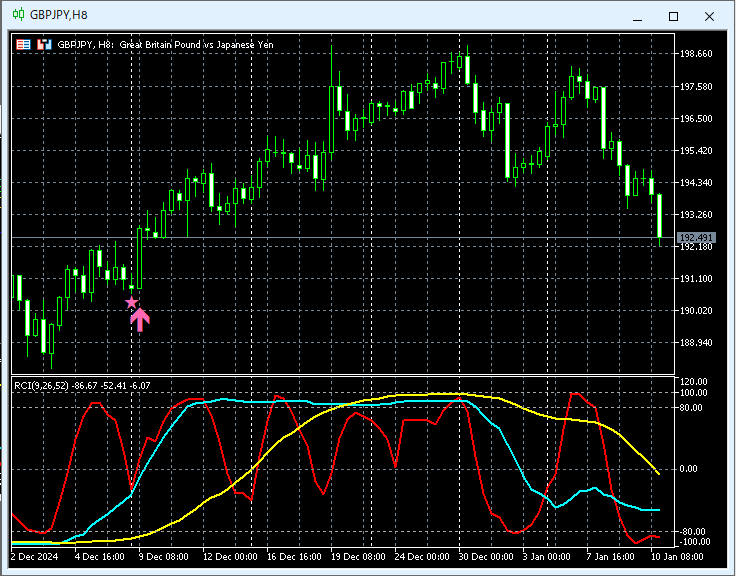
MT5 provides8-hour chart as the standard.
EURJPY 8-hour chart
GBPJPY 8-hour chart
An indicator that shines in combination with RCI【BODSOR・mBDSR】
and methods / case studies (PDF) ★GogoJungle AWARD2020 winner★
https://www.gogojungle.co.jp/tools/indicators/11836
The PDF file comes with 358 items (over 1,400 pages, over 470,000 characters).
Most of them areexamples where the three RCI lines are used to logically link higher and lower timeframes, sequentially examining multiple lower-timeframe conditions, and ultimately waiting for dip-buy or pullback-sell timing (the mBDSR signal) on the lower timeframe..
Also,many focus on capturing points where multiple entry reasons align.More than usual.
Additionally,there is also a method for exploring upside and downside targets using three RCI lines..
In the PDF explanations,more than 1,350 chartsare used.

mBDSR (Product ID 11836) Purchase Bonus】 MT5 Version Indicator (Beta) “mBDSR (no filter, RCI filter, MA filter)”
https://www.gogojungle.co.jp/tools/indicators/56765
【Master RCI!! Trend reversal, Buy on dips, Sell on rallies】
An indicator that shines in combination with RCI【BODSOR・mBDSR】
and methods / case studies (PDF) ★GogoJungle AWARD2020 winner★
https://www.gogojungle.co.jp/tools/indicators/11836
MT5 provides8-hour chart as the standard.
EURJPY 8-hour chart
GBPJPY 8-hour chart
An indicator that shines in combination with RCI【BODSOR・mBDSR】
and methods / case studies (PDF) ★GogoJungle AWARD2020 winner★
https://www.gogojungle.co.jp/tools/indicators/11836
The PDF file comes with 358 items (over 1,400 pages, over 470,000 characters).
Most of them areexamples where the three RCI lines are used to logically link higher and lower timeframes, sequentially examining multiple lower-timeframe conditions, and ultimately waiting for dip-buy or pullback-sell timing (the mBDSR signal) on the lower timeframe..
Also,many focus on capturing points where multiple entry reasons align.More than usual.
Additionally,there is also a method for exploring upside and downside targets using three RCI lines..
In the PDF explanations,more than 1,350 chartsare used.
× ![]()


