

【Pound/Yen】US employment data and mBDSR (RCI2 two-filter) selling signal
【MT5版 Beta】 has been released!!
mBDSR (Product ID 11836) Purchase Bonus】 MT5 version Indicator (Beta) “mBDSR (No filter, RCI filter, MA filter)”
https://www.gogojungle.co.jp/tools/indicators/56765
【Master RCI!! Trend reversal, Buy on dips, Sell on rallies】
An indicator that shines when combined with RCI【BODSOR・mBDSR】
and Method / Case Studies (PDF) ★GogoJungle AWARD2020 winner★
https://www.gogojungle.co.jp/tools/indicators/11836
Pound-Yen GBPJPY 30-minute chart
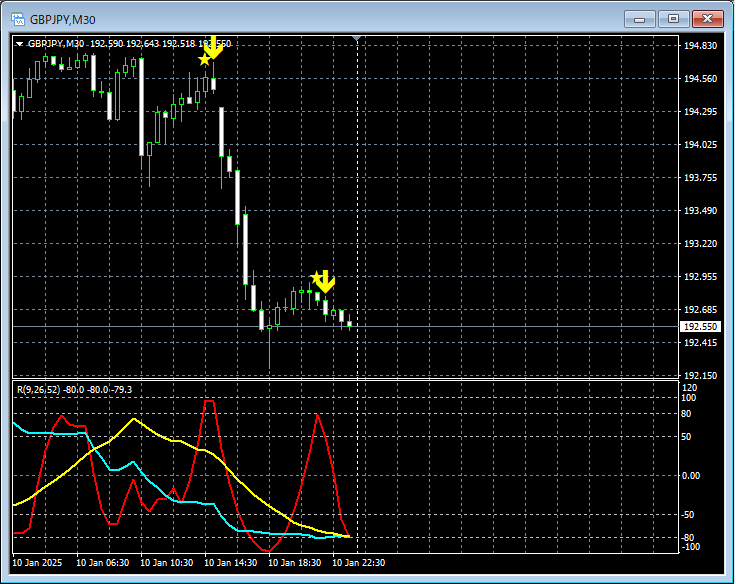
In the 30-minute chart above,mBDSR (Filters: RCI26 and RCI52) Sell-on-rise signalactivated,U.S. Nonfarm Payrollsreport caused the drop to accelerate.
Pound-Yen GBPJPY 5-minute chart
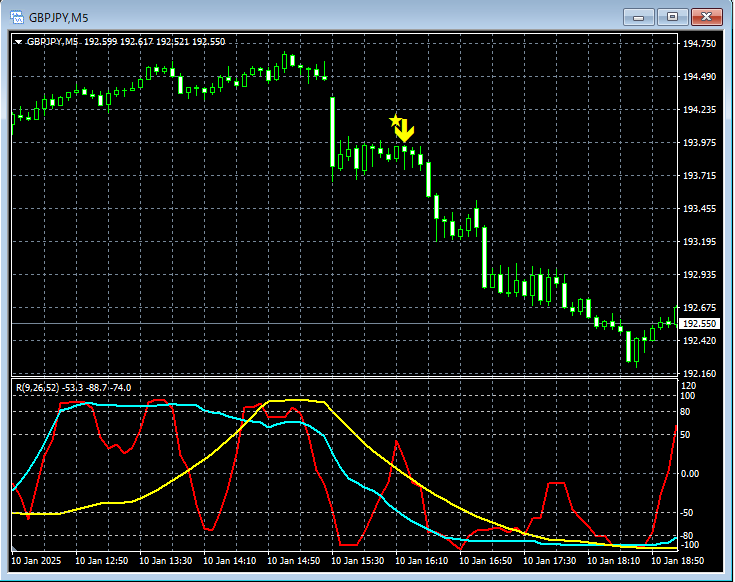
In the 5-minute chart above,U.S. Nonfarm Payrollsannouncement led to a fall, followed by a risemBDSR (Filters: RCI26 and RCI52) Sell-on-rise signallights up and price drops sharply.
*Note: In the charts introduced in this article, for convenience of explanation, circles, lines, and squares may be drawn as additions.
An indicator that shines when combined with RCI【BODSOR・mBDSR】
and Method / Case Studies (PDF) ★GogoJungle AWARD2020 winner★
https://www.gogojungle.co.jp/tools/indicators/11836
The PDF file includes 358 files (over 1,400 pages, over 470,000 words).
Many of them are focused onlogically linking higher and lower timeframes using three RCI lines to examine multiple lower-timeframe conditions sequentially, ultimately waiting for buying on dips or selling on rallies (mBDSR signals) on the lower timeframesas examples.
Also,there are many that emphasize identifying points where multiple entry reasons converge.
Furthermore,there are techniques that use the three-line RCI to explore upside and downside targetsas well.
In the PDF explanations,more than 1,350 chartsare used.

mBDSR (Product ID 11836) Purchase Bonus】 MT5 version Indicator (Beta) “mBDSR (No filter, RCI filter, MA filter)”
https://www.gogojungle.co.jp/tools/indicators/56765
【Master RCI!! Trend reversal, Buy on dips, Sell on rallies】
An indicator that shines when combined with RCI【BODSOR・mBDSR】
and Method / Case Studies (PDF) ★GogoJungle AWARD2020 winner★
https://www.gogojungle.co.jp/tools/indicators/11836
Pound-Yen GBPJPY 30-minute chart
In the 30-minute chart above,mBDSR (Filters: RCI26 and RCI52) Sell-on-rise signalactivated,U.S. Nonfarm Payrollsreport caused the drop to accelerate.
Pound-Yen GBPJPY 5-minute chart
In the 5-minute chart above,U.S. Nonfarm Payrollsannouncement led to a fall, followed by a risemBDSR (Filters: RCI26 and RCI52) Sell-on-rise signallights up and price drops sharply.
*Note: In the charts introduced in this article, for convenience of explanation, circles, lines, and squares may be drawn as additions.
An indicator that shines when combined with RCI【BODSOR・mBDSR】
and Method / Case Studies (PDF) ★GogoJungle AWARD2020 winner★
https://www.gogojungle.co.jp/tools/indicators/11836
The PDF file includes 358 files (over 1,400 pages, over 470,000 words).
Many of them are focused onlogically linking higher and lower timeframes using three RCI lines to examine multiple lower-timeframe conditions sequentially, ultimately waiting for buying on dips or selling on rallies (mBDSR signals) on the lower timeframesas examples.
Also,there are many that emphasize identifying points where multiple entry reasons converge.
Furthermore,there are techniques that use the three-line RCI to explore upside and downside targetsas well.
In the PDF explanations,more than 1,350 chartsare used.
× ![]()


