

Important moving average line, counter-trend line, double top, and mBDSR (RCI two-line filter) (1)
============
【Special Video vol.01/Blacksun】
https://www.gogojungle.co.jp/info/22955
【Special Video vol.02/Blacksun】
https://www.gogojungle.co.jp/info/22956
【Special Video vol.03/Blacksun】
https://www.gogojungle.co.jp/info/22957
============
The MT5 version Beta has been released!!
mBDSR (Product ID 11836) Purchase Bonus] MT5 Indicator (Beta) “mBDSR (no filter, RCI filter, MA filter)”
https://www.gogojungle.co.jp/tools/indicators/56765
An indicator that shines when used in combination with RCI: 【BODSOR・mBDSR】
and a method/case study (PDF) ★GogoJungle AWARD 2020 winner★
https://www.gogojungle.co.jp/tools/indicators/11836
AUD/USD 15-minute chart
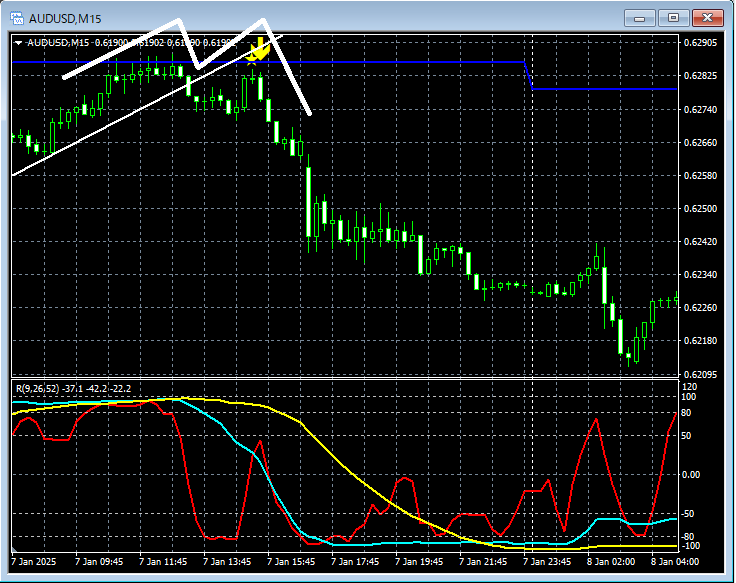
The higher timeframe context is omitted. In this 15-minute chart case, the upper timeframe context is deemed importantDaily EMA21rises up nearby, then shows a retreat.Counter-trend linebreaks below, followed by a risemBDSR (RCI 2-filter) oversell signallights up, and prices subsequently move lower steadily.
As a resultthe right-side peak of the double topbegins to fall at a timing that iscaptured well by the mBDSR (RCI 2-filter) oversell signal.
From this example,the trading method focusing on key moving averages, counter-trend lines, and double topsandthe signal of mBDSRshow a strong harmony.
Also in this example, placing the stop-loss slightly above the recent high (the left side of the double top)allows for a high risk-reward trade.
※ Please note that the charts shown in this article may include added circles, lines, and rectangles for explanatory convenience.
The indicator that shines in combination with RCI: 【BODSOR・mBDSR】
and method/case study (PDF) ★GogoJungle AWARD 2020 winner★
https://www.gogojungle.co.jp/tools/indicators/11836
The PDF file includes 358 items (over 1,400 pages, over 470,000 characters).
Many of them are summarized as: using three-line RCI to logically link higher and lower timeframes, sequentially considering multiple lower timeframes, and ultimately waiting for buy-on-dips or sell-on-rallies on the lower timeframe (i.e., the mBDSR signal).
Additionally,many focus on identifying points where multiple entry justifications overlap..
Moreover,there are also methods to explore upside and downside targets using three-line RCI..
In the PDF explanations,over 1,350 chartsare used.

【Special Video vol.01/Blacksun】
https://www.gogojungle.co.jp/info/22955
【Special Video vol.02/Blacksun】
https://www.gogojungle.co.jp/info/22956
【Special Video vol.03/Blacksun】
https://www.gogojungle.co.jp/info/22957
============
The MT5 version Beta has been released!!
mBDSR (Product ID 11836) Purchase Bonus] MT5 Indicator (Beta) “mBDSR (no filter, RCI filter, MA filter)”
https://www.gogojungle.co.jp/tools/indicators/56765
An indicator that shines when used in combination with RCI: 【BODSOR・mBDSR】
and a method/case study (PDF) ★GogoJungle AWARD 2020 winner★
https://www.gogojungle.co.jp/tools/indicators/11836
AUD/USD 15-minute chart
The higher timeframe context is omitted. In this 15-minute chart case, the upper timeframe context is deemed importantDaily EMA21rises up nearby, then shows a retreat.Counter-trend linebreaks below, followed by a risemBDSR (RCI 2-filter) oversell signallights up, and prices subsequently move lower steadily.
As a resultthe right-side peak of the double topbegins to fall at a timing that iscaptured well by the mBDSR (RCI 2-filter) oversell signal.
From this example,the trading method focusing on key moving averages, counter-trend lines, and double topsandthe signal of mBDSRshow a strong harmony.
Also in this example, placing the stop-loss slightly above the recent high (the left side of the double top)allows for a high risk-reward trade.
※ Please note that the charts shown in this article may include added circles, lines, and rectangles for explanatory convenience.
The indicator that shines in combination with RCI: 【BODSOR・mBDSR】
and method/case study (PDF) ★GogoJungle AWARD 2020 winner★
https://www.gogojungle.co.jp/tools/indicators/11836
The PDF file includes 358 items (over 1,400 pages, over 470,000 characters).
Many of them are summarized as: using three-line RCI to logically link higher and lower timeframes, sequentially considering multiple lower timeframes, and ultimately waiting for buy-on-dips or sell-on-rallies on the lower timeframe (i.e., the mBDSR signal).
Additionally,many focus on identifying points where multiple entry justifications overlap..
Moreover,there are also methods to explore upside and downside targets using three-line RCI..
In the PDF explanations,over 1,350 chartsare used.
× ![]()


