

Mastering RCI!! Dollar-Yen: Break above the retracement high and mBDSR (RCI two-filter) pullback buying signal
0
【MT5 Version Beta】 has been released!!
mBDSR (Product ID 11836) Purchase Bonus】MT5 Version Indicator (Beta) “mBDSR (No Filter, RCI Filter, MA Filter)”
https://www.gogojungle.co.jp/tools/indicators/56765
【Master RCI!! Trend Reversal, Buy the Dip, Sell the Retracement】
An indicator that shines when combined with RCI【BODSOR・mBDSR】
and method & case study (PDF) ★GogoJungle AWARD2020 Winner★
https://www.gogojungle.co.jp/tools/indicators/11836
USD/JPY 15-minute chart
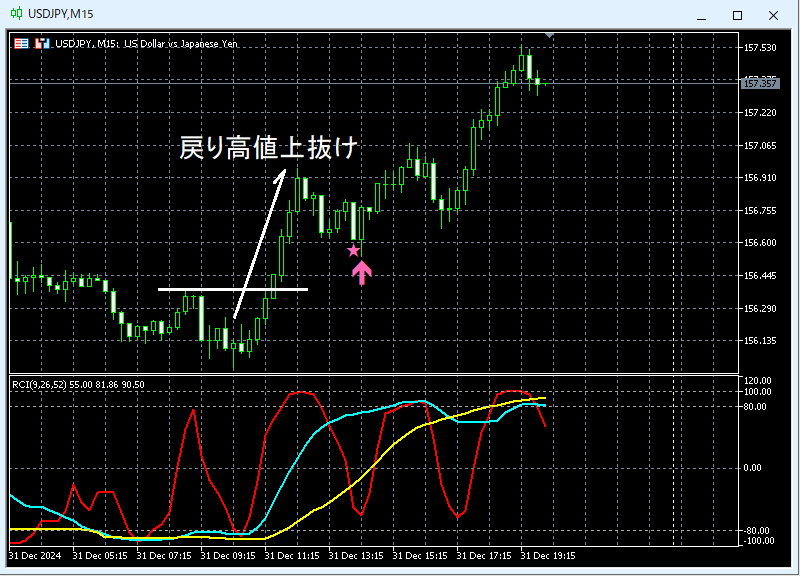
In the 15-minute chart above, there is a rebound from a downward trend. AndThe Rebound Highafter breaking above it, it moved downmBDSR (Filter: RCI26 and RCI52) Buy-the-Dip signallights up and the price reliably rises.
From this example,A trading method focusing on the rebound high (Dow Theory)andthe alignment with mBDSR signalsshow a strong synergy.
※ Please note that in the charts introduced in this article, for convenience in explanation, circles, lines, and rectangles may be drawn.
An indicator that shines when combined with RCI【BODSOR・mBDSR】
and method & case study (PDF) ★GogoJungle AWARD2020 Winner★
https://www.gogojungle.co.jp/tools/indicators/11836
The PDF file includes 358 items (over 1,400 pages, over 470,000 characters).
Many of these areexamples that lay out how to logically link higher and lower timeframes using three RCI lines, gradually considering the状況 of multiple lower timeframes and ultimately waiting for a dip-buy or a retrace-sell timing (i.e., mBDSR signals) on the lower timeframes..
Additionally,there are many that emphasize identifying points where multiple entry reasons overlap..
Furthermore,there are methods for exploring upside and downside targets using three RCI lines..
In the PDF explanations,more than 1,350 chartsare used.

mBDSR (Product ID 11836) Purchase Bonus】MT5 Version Indicator (Beta) “mBDSR (No Filter, RCI Filter, MA Filter)”
https://www.gogojungle.co.jp/tools/indicators/56765
【Master RCI!! Trend Reversal, Buy the Dip, Sell the Retracement】
An indicator that shines when combined with RCI【BODSOR・mBDSR】
and method & case study (PDF) ★GogoJungle AWARD2020 Winner★
https://www.gogojungle.co.jp/tools/indicators/11836
USD/JPY 15-minute chart
In the 15-minute chart above, there is a rebound from a downward trend. AndThe Rebound Highafter breaking above it, it moved downmBDSR (Filter: RCI26 and RCI52) Buy-the-Dip signallights up and the price reliably rises.
From this example,A trading method focusing on the rebound high (Dow Theory)andthe alignment with mBDSR signalsshow a strong synergy.
※ Please note that in the charts introduced in this article, for convenience in explanation, circles, lines, and rectangles may be drawn.
An indicator that shines when combined with RCI【BODSOR・mBDSR】
and method & case study (PDF) ★GogoJungle AWARD2020 Winner★
https://www.gogojungle.co.jp/tools/indicators/11836
The PDF file includes 358 items (over 1,400 pages, over 470,000 characters).
Many of these areexamples that lay out how to logically link higher and lower timeframes using three RCI lines, gradually considering the状況 of multiple lower timeframes and ultimately waiting for a dip-buy or a retrace-sell timing (i.e., mBDSR signals) on the lower timeframes..
Additionally,there are many that emphasize identifying points where multiple entry reasons overlap..
Furthermore,there are methods for exploring upside and downside targets using three RCI lines..
In the PDF explanations,more than 1,350 chartsare used.
× ![]()


